Annual Report 2011 - Ford Motor Company
Annual Report 2011 - Ford Motor Company
Annual Report 2011 - Ford Motor Company

Create successful ePaper yourself
Turn your PDF publications into a flip-book with our unique Google optimized e-Paper software.
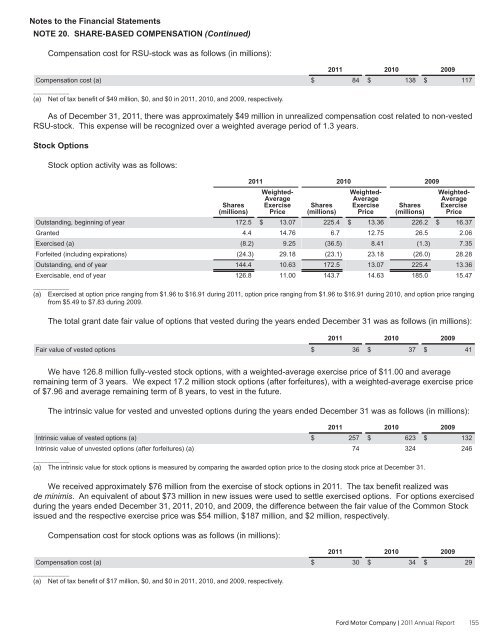
Notes to the Financial Statements<br />
NOTE 20. SHARE-BASED COMPENSATION (Continued)<br />
Compensation cost for RSU-stock was as follows (in millions):<br />
Compensation cost (a)<br />
__________<br />
(a) Net of tax benefit of $49 million, $0, and $0 in <strong>2011</strong>, 2010, and 2009, respectively.<br />
<strong>2011</strong><br />
$ 84<br />
2010<br />
$ 138<br />
2009<br />
$ 117<br />
As of December 31, <strong>2011</strong>, there was approximately $49 million in unrealized compensation cost related to non-vested<br />
RSU-stock. This expense will be recognized over a weighted average period of 1.3 years.<br />
Stock Options<br />
Stock option activity was as follows:<br />
<strong>2011</strong><br />
Shares<br />
(millions)<br />
Weighted-<br />
Average<br />
Exercise<br />
Price<br />
Shares<br />
(millions)<br />
Weighted-<br />
Average<br />
Exercise<br />
Price<br />
Shares<br />
(millions)<br />
Weighted-<br />
Average<br />
Exercise<br />
Price<br />
Outstanding, beginning of year<br />
172.5 $ 13.07 225.4 $ 13.36 226.2 $ 16.37<br />
Granted<br />
4.4 14.76<br />
6.7 12.75 26.5 2.06<br />
Exercised (a)<br />
(8.2) 9.25 (36.5) 8.41<br />
(1.3) 7.35<br />
Forfeited (including expirations)<br />
(24.3) 29.18 (23.1) 23.18 (26.0) 28.28<br />
Outstanding, end of year<br />
144.4 10.63 172.5 13.07 225.4 13.36<br />
Exercisable, end of year<br />
__________<br />
126.8 11.00 143.7 14.63 185.0 15.47<br />
(a) Exercised at option price ranging from $1.96 to $16.91 during <strong>2011</strong>, option price ranging from $1.96 to $16.91 during 2010, and option price ranging<br />
from $5.49 to $7.83 during 2009.<br />
The total grant date fair value of options that vested during the years ended December 31 was as follows (in millions):<br />
Fair value of vested options<br />
2010<br />
<strong>2011</strong><br />
$ 36<br />
2010<br />
$ 37<br />
2009<br />
2009<br />
$ 41<br />
We have 126.8 million fully-vested stock options, with a weighted-average exercise price of $11.00 and average<br />
remaining term of 3 years. We expect 17.2 million stock options (after forfeitures), with a weighted-average exercise price<br />
of $7.96 and average remaining term of 8 years, to vest in the future.<br />
The intrinsic value for vested and unvested options during the years ended December 31 was as follows (in millions):<br />
<strong>2011</strong><br />
2010<br />
2009<br />
Intrinsic value of vested options (a)<br />
$ 257 $ 623 $ 132<br />
Intrinsic value of unvested options (after forfeitures) (a)<br />
__________<br />
74<br />
324<br />
246<br />
(a) The intrinsic value for stock options is measured by comparing the awarded option price to the closing stock price at December 31.<br />
We received approximately $76 million from the exercise of stock options in <strong>2011</strong>. The tax benefit realized was<br />
de minimis. An equivalent of about $73 million in new issues were used to settle exercised options. For options exercised<br />
during the years ended December 31, <strong>2011</strong>, 2010, and 2009, the difference between the fair value of the Common Stock<br />
issued and the respective exercise price was $54 million, $187 million, and $2 million, respectively.<br />
Compensation cost for stock options was as follows (in millions):<br />
Compensation cost (a)<br />
__________<br />
(a) Net of tax benefit of $17 million, $0, and $0 in <strong>2011</strong>, 2010, and 2009, respectively.<br />
<strong>2011</strong><br />
$ 30<br />
2010<br />
$ 34<br />
2009<br />
$ 29<br />
<strong>Ford</strong> <strong>Motor</strong> <strong>Company</strong> | <strong>2011</strong> <strong>Annual</strong> <strong>Report</strong> 155