Annual Report 2011 - Ford Motor Company
Annual Report 2011 - Ford Motor Company
Annual Report 2011 - Ford Motor Company

You also want an ePaper? Increase the reach of your titles
YUMPU automatically turns print PDFs into web optimized ePapers that Google loves.
Management’s Discussion and Analysis of Financial Condition and Results of Operations<br />
<strong>Ford</strong> Credit's North America segment accounted for 96% of its total operating leases at December 31, <strong>2011</strong>. The<br />
following table shows operating lease placement, termination, and return volumes for this segment for the years ended<br />
December 31 (in thousands, except for percentages):<br />
Placements<br />
Terminations<br />
Returns<br />
Memo:<br />
Return Rates<br />
In <strong>2011</strong>, placement volumes were up 99,000 units compared with 2010, primarily reflecting higher industry sales,<br />
higher <strong>Ford</strong> market share, and changes in <strong>Ford</strong>'s marketing programs. Termination volumes decreased by 162,000 units<br />
in <strong>2011</strong> compared with 2010, reflecting lower placement volumes in the second half of 2008 and 2009. Return volumes<br />
decreased 137,000 units in <strong>2011</strong> compared with 2010, primarily reflecting fewer terminations and lower return rates.<br />
U.S. <strong>Ford</strong> and Lincoln Brand Operating Lease Experience<br />
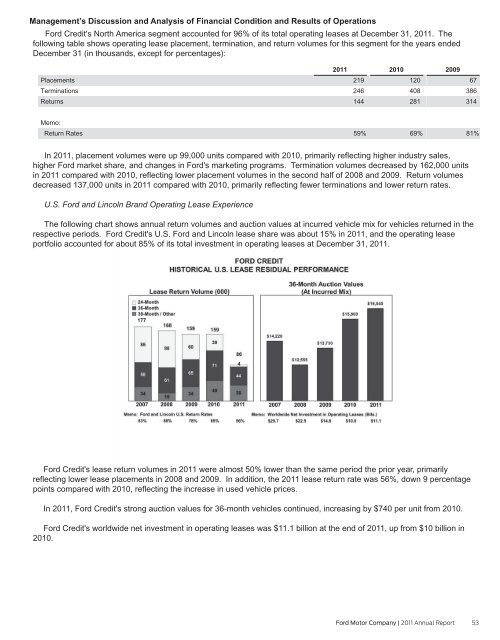
The following chart shows annual return volumes and auction values at incurred vehicle mix for vehicles returned in the<br />
respective periods. <strong>Ford</strong> Credit's U.S. <strong>Ford</strong> and Lincoln lease share was about 15% in <strong>2011</strong>, and the operating lease<br />
portfolio accounted for about 85% of its total investment in operating leases at December 31, <strong>2011</strong>.<br />
<strong>Ford</strong> Credit's lease return volumes in <strong>2011</strong> were almost 50% lower than the same period the prior year, primarily<br />
reflecting lower lease placements in 2008 and 2009. In addition, the <strong>2011</strong> lease return rate was 56%, down 9 percentage<br />
points compared with 2010, reflecting the increase in used vehicle prices.<br />
In <strong>2011</strong>, <strong>Ford</strong> Credit's strong auction values for 36-month vehicles continued, increasing by $740 per unit from 2010.<br />
<strong>Ford</strong> Credit's worldwide net investment in operating leases was $11.1 billion at the end of <strong>2011</strong>, up from $10 billion in<br />
2010.<br />
<strong>2011</strong><br />
219<br />
246<br />
144<br />
59%<br />
2010<br />
120<br />
408<br />
281<br />
69%<br />
2009<br />
67<br />
386<br />
314<br />
81%<br />
<strong>Ford</strong> <strong>Motor</strong> <strong>Company</strong> | <strong>2011</strong> <strong>Annual</strong> <strong>Report</strong> 53