Annual Report 2011 - Ford Motor Company
Annual Report 2011 - Ford Motor Company
Annual Report 2011 - Ford Motor Company

Create successful ePaper yourself
Turn your PDF publications into a flip-book with our unique Google optimized e-Paper software.
Management’s Discussion and Analysis of Financial Condition and Results of Operations<br />
<strong>2011</strong> Compared with 2010<br />
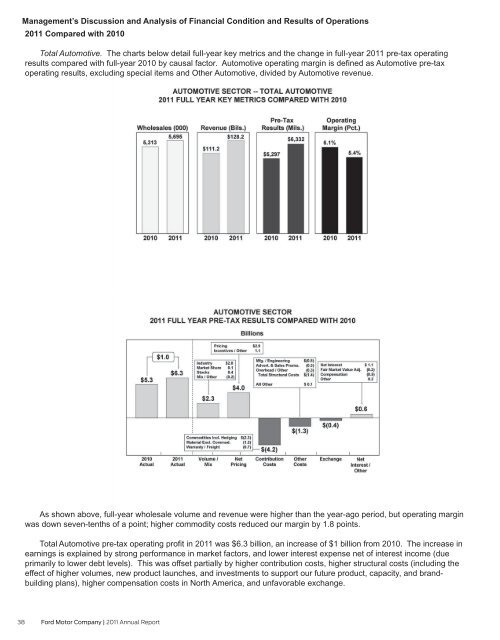
Total Automotive. The charts below detail full-year key metrics and the change in full-year <strong>2011</strong> pre-tax operating<br />
results compared with full-year 2010 by causal factor. Automotive operating margin is defined as Automotive pre-tax<br />
operating results, excluding special items and Other Automotive, divided by Automotive revenue.<br />
As shown above, full-year wholesale volume and revenue were higher than the year-ago period, but operating margin<br />
was down seven-tenths of a point; higher commodity costs reduced our margin by 1.8 points.<br />
Total Automotive pre-tax operating profit in <strong>2011</strong> was $6.3 billion, an increase of $1 billion from 2010. The increase in<br />
earnings is explained by strong performance in market factors, and lower interest expense net of interest income (due<br />
primarily to lower debt levels). This was offset partially by higher contribution costs, higher structural costs (including the<br />
effect of higher volumes, new product launches, and investments to support our future product, capacity, and brandbuilding<br />
plans), higher compensation costs in North America, and unfavorable exchange.<br />
38 <strong>Ford</strong> <strong>Motor</strong> <strong>Company</strong> | <strong>2011</strong> <strong>Annual</strong> <strong>Report</strong>