Annual Report 2011 - Ford Motor Company
Annual Report 2011 - Ford Motor Company
Annual Report 2011 - Ford Motor Company

You also want an ePaper? Increase the reach of your titles
YUMPU automatically turns print PDFs into web optimized ePapers that Google loves.
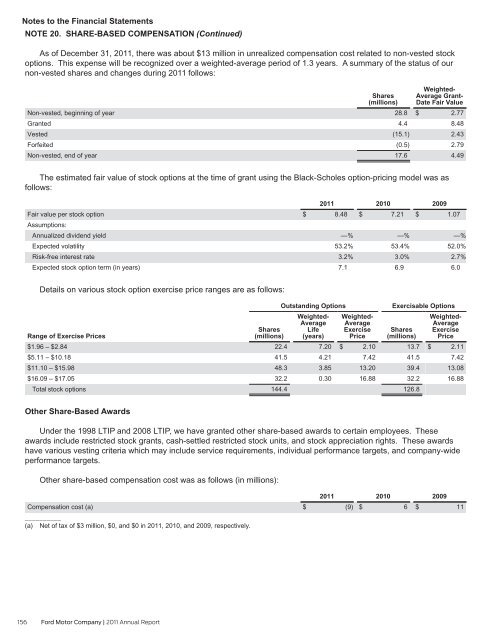
Notes to the Financial Statements<br />
NOTE 20. SHARE-BASED COMPENSATION (Continued)<br />
As of December 31, <strong>2011</strong>, there was about $13 million in unrealized compensation cost related to non-vested stock<br />
options. This expense will be recognized over a weighted-average period of 1.3 years. A summary of the status of our<br />
non-vested shares and changes during <strong>2011</strong> follows:<br />
Non-vested, beginning of year<br />
Granted<br />
Vested<br />
Forfeited<br />
Non-vested, end of year<br />
156 <strong>Ford</strong> <strong>Motor</strong> <strong>Company</strong> | <strong>2011</strong> <strong>Annual</strong> <strong>Report</strong><br />
Shares<br />
(millions)<br />
28.8<br />
4.4<br />
(15.1)<br />
(0.5)<br />
17.6<br />
Weighted-<br />
Average Grant-<br />
Date Fair Value<br />
$ 2.77<br />
8.48<br />
2.43<br />
2.79<br />
4.49<br />
The estimated fair value of stock options at the time of grant using the Black-Scholes option-pricing model was as<br />
follows:<br />
Fair value per stock option<br />
Assumptions:<br />
<strong>Annual</strong>ized dividend yield<br />
Expected volatility<br />
Risk-free interest rate<br />
Expected stock option term (in years)<br />
Details on various stock option exercise price ranges are as follows:<br />
Range of Exercise Prices<br />
$1.96 – $2.84<br />
$5.11 – $10.18<br />
$11.10 – $15.98<br />
$16.09 – $17.05<br />
Total stock options<br />
Other Share-Based Awards<br />
Shares<br />
(millions)<br />
22.4<br />
41.5<br />
48.3<br />
32.2<br />
144.4<br />
<strong>2011</strong><br />
$ 8.48<br />
—%<br />
53.2%<br />
3.2%<br />
7.1<br />
Outstanding Options<br />
Weighted-<br />
Average<br />
Life<br />
(years)<br />
7.20<br />
4.21<br />
3.85<br />
0.30<br />
2010<br />
$ 7.21<br />
Weighted-<br />
Average<br />
Exercise<br />
Price<br />
$ 2.10<br />
7.42<br />
13.20<br />
16.88<br />
—%<br />
53.4%<br />
3.0%<br />
6.9<br />
2009<br />
$ 1.07<br />
Exercisable Options<br />
Shares<br />
(millions)<br />
13.7<br />
41.5<br />
39.4<br />
32.2<br />
126.8<br />
—%<br />
52.0%<br />
2.7%<br />
6.0<br />
Weighted-<br />
Average<br />
Exercise<br />
Price<br />
$ 2.11<br />
7.42<br />
13.08<br />
16.88<br />
Under the 1998 LTIP and 2008 LTIP, we have granted other share-based awards to certain employees. These<br />
awards include restricted stock grants, cash-settled restricted stock units, and stock appreciation rights. These awards<br />
have various vesting criteria which may include service requirements, individual performance targets, and company-wide<br />
performance targets.<br />
Other share-based compensation cost was as follows (in millions):<br />
Compensation cost (a)<br />
__________<br />
(a) Net of tax of $3 million, $0, and $0 in <strong>2011</strong>, 2010, and 2009, respectively.<br />
<strong>2011</strong><br />
$ (9)<br />
2010<br />
$ 6<br />
2009<br />
$ 11