Annual Report 2011 - Ford Motor Company
Annual Report 2011 - Ford Motor Company
Annual Report 2011 - Ford Motor Company

Create successful ePaper yourself
Turn your PDF publications into a flip-book with our unique Google optimized e-Paper software.
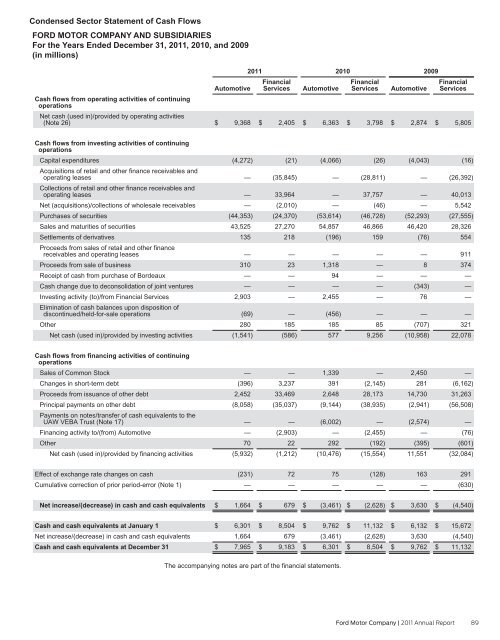
Condensed Sector Statement of Cash Flows<br />
FORD MOTOR COMPANY AND SUBSIDIARIES<br />
For the Years Ended December 31, <strong>2011</strong>, 2010, and 2009<br />
(in millions)<br />
Cash flows from operating activities of continuing<br />
operations<br />
Net cash (used in)/provided by operating activities<br />
(Note 26)<br />
Cash flows from investing activities of continuing<br />
operations<br />
Capital expenditures<br />
Acquisitions of retail and other finance receivables and<br />
operating leases<br />
Collections of retail and other finance receivables and<br />
operating leases<br />
Net (acquisitions)/collections of wholesale receivables<br />
Purchases of securities<br />
Sales and maturities of securities<br />
Settlements of derivatives<br />
Proceeds from sales of retail and other finance<br />
receivables and operating leases<br />
Proceeds from sale of business<br />
Receipt of cash from purchase of Bordeaux<br />
Cash change due to deconsolidation of joint ventures<br />
Investing activity (to)/from Financial Services<br />
Elimination of cash balances upon disposition of<br />
discontinued/held-for-sale operations<br />
Other<br />
Net cash (used in)/provided by investing activities<br />
Cash flows from financing activities of continuing<br />
operations<br />
Sales of Common Stock<br />
Changes in short-term debt<br />
Proceeds from issuance of other debt<br />
Principal payments on other debt<br />
Payments on notes/transfer of cash equivalents to the<br />
UAW VEBA Trust (Note 17)<br />
Financing activity to/(from) Automotive<br />
Other<br />
Net cash (used in)/provided by financing activities<br />
Effect of exchange rate changes on cash<br />
Cumulative correction of prior period-error (Note 1)<br />
Net increase/(decrease) in cash and cash equivalents<br />
Cash and cash equivalents at January 1<br />
Net increase/(decrease) in cash and cash equivalents<br />
Cash and cash equivalents at December 31<br />
Automotive<br />
$ 9,368<br />
(4,272)<br />
—<br />
—<br />
—<br />
(44,353)<br />
43,525<br />
135<br />
—<br />
310<br />
—<br />
—<br />
2,903<br />
(69)<br />
280<br />
(1,541)<br />
—<br />
(396)<br />
2,452<br />
(8,058)<br />
—<br />
—<br />
70<br />
(5,932)<br />
(231)<br />
—<br />
$ 1,664<br />
$ 6,301<br />
1,664<br />
$ 7,965<br />
<strong>2011</strong><br />
Financial<br />
Services<br />
$ 2,405<br />
(21)<br />
(35,845)<br />
33,964<br />
(2,010)<br />
(24,370)<br />
27,270<br />
218<br />
—<br />
23<br />
—<br />
—<br />
—<br />
—<br />
185<br />
(586)<br />
—<br />
3,237<br />
33,469<br />
(35,037)<br />
—<br />
(2,903)<br />
22<br />
(1,212)<br />
72<br />
—<br />
$ 679<br />
$ 8,504<br />
679<br />
$ 9,183<br />
Automotive<br />
$ 6,363<br />
(4,066)<br />
2010<br />
—<br />
—<br />
—<br />
(53,614)<br />
54,857<br />
(196)<br />
—<br />
1,318<br />
94<br />
—<br />
2,455<br />
(456)<br />
185<br />
577<br />
1,339<br />
391<br />
2,648<br />
(9,144)<br />
(6,002)<br />
—<br />
292<br />
(10,476)<br />
75<br />
—<br />
$ (3,461)<br />
$ 9,762<br />
(3,461)<br />
$ 6,301<br />
The accompanying notes are part of the financial statements.<br />
Financial<br />
Services<br />
$ 3,798<br />
(26)<br />
(28,811)<br />
37,757<br />
(46)<br />
(46,728)<br />
46,866<br />
159<br />
—<br />
—<br />
—<br />
—<br />
—<br />
—<br />
85<br />
9,256<br />
—<br />
(2,145)<br />
28,173<br />
(38,935)<br />
—<br />
(2,455)<br />
(192)<br />
(15,554)<br />
(128)<br />
—<br />
$ (2,628)<br />
$ 11,132<br />
(2,628)<br />
$ 8,504<br />
Automotive<br />
$ 2,874<br />
(4,043)<br />
2009<br />
<strong>Ford</strong> <strong>Motor</strong> <strong>Company</strong> | <strong>2011</strong> <strong>Annual</strong> <strong>Report</strong> 89<br />
—<br />
—<br />
—<br />
(52,293)<br />
46,420<br />
(76)<br />
—<br />
8<br />
—<br />
(343)<br />
76<br />
—<br />
(707)<br />
(10,958)<br />
2,450<br />
281<br />
14,730<br />
(2,941)<br />
(2,574)<br />
—<br />
(395)<br />
11,551<br />
163<br />
—<br />
$ 3,630<br />
$ 6,132<br />
3,630<br />
$ 9,762<br />
Financial<br />
Services<br />
$ 5,805<br />
(16)<br />
(26,392)<br />
40,013<br />
5,542<br />
(27,555)<br />
28,326<br />
554<br />
911<br />
374<br />
—<br />
—<br />
—<br />
—<br />
321<br />
22,078<br />
—<br />
(6,162)<br />
31,263<br />
(56,508)<br />
—<br />
(76)<br />
(601)<br />
(32,084)<br />
291<br />
(630)<br />
$ (4,540)<br />
$ 15,672<br />
(4,540)<br />
$ 11,132