Annual Report 2011 - Ford Motor Company
Annual Report 2011 - Ford Motor Company
Annual Report 2011 - Ford Motor Company

You also want an ePaper? Increase the reach of your titles
YUMPU automatically turns print PDFs into web optimized ePapers that Google loves.
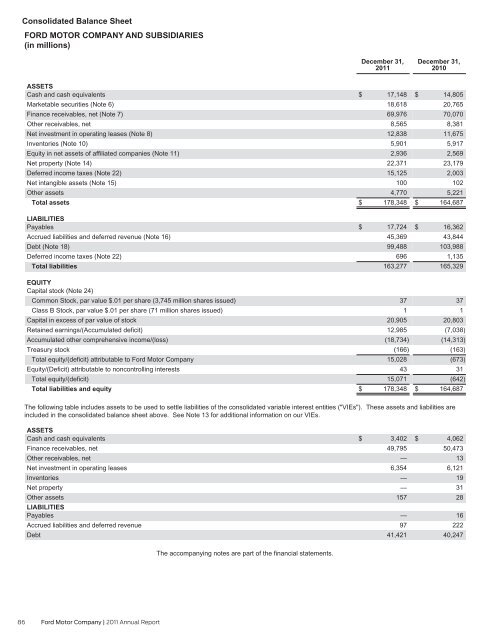
Consolidated Balance Sheet<br />
FORD MOTOR COMPANY AND SUBSIDIARIES<br />
(in millions)<br />
ASSETS<br />
Cash and cash equivalents<br />
Marketable securities (Note 6)<br />
Finance receivables, net (Note 7)<br />
Other receivables, net<br />
Net investment in operating leases (Note 8)<br />
Inventories (Note 10)<br />
Equity in net assets of affiliated companies (Note 11)<br />
Net property (Note 14)<br />
Deferred income taxes (Note 22)<br />
Net intangible assets (Note 15)<br />
Other assets<br />
Total assets<br />
LIABILITIES<br />
Payables<br />
Accrued liabilities and deferred revenue (Note 16)<br />
Debt (Note 18)<br />
Deferred income taxes (Note 22)<br />
Total liabilities<br />
EQUITY<br />
Capital stock (Note 24)<br />
Common Stock, par value $.01 per share (3,745 million shares issued)<br />
Class B Stock, par value $.01 per share (71 million shares issued)<br />
Capital in excess of par value of stock<br />
Retained earnings/(Accumulated deficit)<br />
Accumulated other comprehensive income/(loss)<br />
Treasury stock<br />
Total equity/(deficit) attributable to <strong>Ford</strong> <strong>Motor</strong> <strong>Company</strong><br />
Equity/(Deficit) attributable to noncontrolling interests<br />
Total equity/(deficit)<br />
Total liabilities and equity<br />
86 <strong>Ford</strong> <strong>Motor</strong> <strong>Company</strong> | <strong>2011</strong> <strong>Annual</strong> <strong>Report</strong><br />
December 31,<br />
<strong>2011</strong><br />
$ 17,148<br />
18,618<br />
69,976<br />
8,565<br />
12,838<br />
5,901<br />
2,936<br />
22,371<br />
15,125<br />
100<br />
4,770<br />
$ 178,348<br />
$ 17,724<br />
45,369<br />
99,488<br />
696<br />
163,277<br />
37<br />
1<br />
20,905<br />
12,985<br />
(18,734)<br />
(166)<br />
15,028<br />
43<br />
15,071<br />
$ 178,348<br />
December 31,<br />
2010<br />
$ 14,805<br />
20,765<br />
70,070<br />
8,381<br />
11,675<br />
5,917<br />
2,569<br />
23,179<br />
2,003<br />
102<br />
5,221<br />
$ 164,687<br />
$ 16,362<br />
43,844<br />
103,988<br />
1,135<br />
165,329<br />
37<br />
1<br />
20,803<br />
(7,038)<br />
(14,313)<br />
(163)<br />
(673)<br />
31<br />
(642)<br />
$ 164,687<br />
The following table includes assets to be used to settle liabilities of the consolidated variable interest entities ("VIEs"). These assets and liabilities are<br />
included in the consolidated balance sheet above. See Note 13 for additional information on our VIEs.<br />
ASSETS<br />
Cash and cash equivalents<br />
Finance receivables, net<br />
Other receivables, net<br />
Net investment in operating leases<br />
Inventories<br />
Net property<br />
Other assets<br />
LIABILITIES<br />
Payables<br />
Accrued liabilities and deferred revenue<br />
Debt<br />
The accompanying notes are part of the financial statements.<br />
$ 3,402<br />
49,795<br />
—<br />
6,354<br />
—<br />
—<br />
157<br />
—<br />
97<br />
41,421<br />
$ 4,062<br />
50,473<br />
13<br />
6,121<br />
19<br />
31<br />
28<br />
16<br />
222<br />
40,247