Annual Report 2011 - Ford Motor Company
Annual Report 2011 - Ford Motor Company
Annual Report 2011 - Ford Motor Company

You also want an ePaper? Increase the reach of your titles
YUMPU automatically turns print PDFs into web optimized ePapers that Google loves.
Notes to the Financial Statements<br />
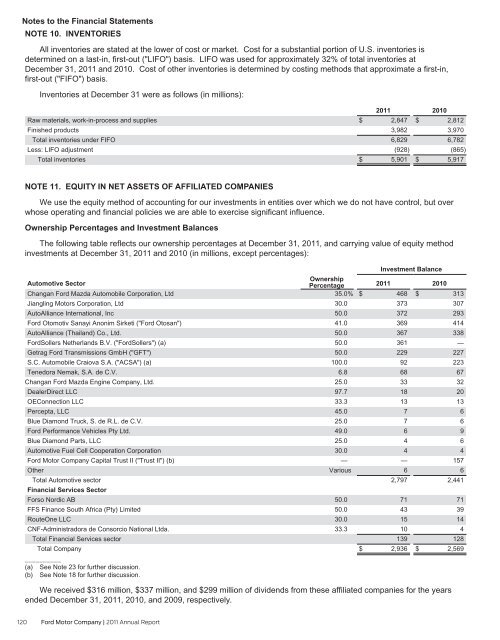
NOTE 10. INVENTORIES<br />
All inventories are stated at the lower of cost or market. Cost for a substantial portion of U.S. inventories is<br />
determined on a last-in, first-out ("LIFO") basis. LIFO was used for approximately 32% of total inventories at<br />
December 31, <strong>2011</strong> and 2010. Cost of other inventories is determined by costing methods that approximate a first-in,<br />
first-out ("FIFO") basis.<br />
Inventories at December 31 were as follows (in millions):<br />
Raw materials, work-in-process and supplies<br />
Finished products<br />
Total inventories under FIFO<br />
Less: LIFO adjustment<br />
Total inventories<br />
NOTE 11. EQUITY IN NET ASSETS OF AFFILIATED COMPANIES<br />
120 <strong>Ford</strong> <strong>Motor</strong> <strong>Company</strong> | <strong>2011</strong> <strong>Annual</strong> <strong>Report</strong><br />
<strong>2011</strong><br />
$ 2,847<br />
3,982<br />
6,829<br />
(928)<br />
$ 5,901<br />
2010<br />
$ 2,812<br />
3,970<br />
6,782<br />
(865)<br />
$ 5,917<br />
We use the equity method of accounting for our investments in entities over which we do not have control, but over<br />
whose operating and financial policies we are able to exercise significant influence.<br />
Ownership Percentages and Investment Balances<br />
The following table reflects our ownership percentages at December 31, <strong>2011</strong>, and carrying value of equity method<br />
investments at December 31, <strong>2011</strong> and 2010 (in millions, except percentages):<br />
Automotive Sector<br />
Changan <strong>Ford</strong> Mazda Automobile Corporation, Ltd<br />
Jiangling <strong>Motor</strong>s Corporation, Ltd<br />
AutoAlliance International, Inc<br />
<strong>Ford</strong> Otomotiv Sanayi Anonim Sirketi ("<strong>Ford</strong> Otosan")<br />
AutoAlliance (Thailand) Co., Ltd.<br />
<strong>Ford</strong>Sollers Netherlands B.V. ("<strong>Ford</strong>Sollers") (a)<br />
Getrag <strong>Ford</strong> Transmissions GmbH ("GFT")<br />
S.C. Automobile Craiova S.A. ("ACSA") (a)<br />
Tenedora Nemak, S.A. de C.V.<br />
Changan <strong>Ford</strong> Mazda Engine <strong>Company</strong>, Ltd.<br />
DealerDirect LLC<br />
OEConnection LLC<br />
Percepta, LLC<br />
Blue Diamond Truck, S. de R.L. de C.V.<br />
<strong>Ford</strong> Performance Vehicles Pty Ltd.<br />
Blue Diamond Parts, LLC<br />
Automotive Fuel Cell Cooperation Corporation<br />
<strong>Ford</strong> <strong>Motor</strong> <strong>Company</strong> Capital Trust II ("Trust II") (b)<br />
Other<br />
Total Automotive sector<br />
Financial Services Sector<br />
Forso Nordic AB<br />
FFS Finance South Africa (Pty) Limited<br />
RouteOne LLC<br />
CNF-Administradora de Consorcio National Ltda.<br />
Total Financial Services sector<br />
Total <strong>Company</strong><br />
__________<br />
(a) See Note 23 for further discussion.<br />
(b) See Note 18 for further discussion.<br />
Ownership<br />
Percentage<br />
35.0%<br />
30.0<br />
50.0<br />
41.0<br />
50.0<br />
50.0<br />
50.0<br />
100.0<br />
6.8<br />
25.0<br />
97.7<br />
33.3<br />
45.0<br />
25.0<br />
49.0<br />
25.0<br />
30.0<br />
—<br />
Various<br />
50.0<br />
50.0<br />
30.0<br />
33.3<br />
Investment Balance<br />
<strong>2011</strong><br />
$ 468<br />
373<br />
372<br />
369<br />
367<br />
361<br />
229<br />
92<br />
68<br />
33<br />
18<br />
13<br />
7<br />
7<br />
6<br />
4<br />
4<br />
—<br />
6<br />
2,797<br />
71<br />
43<br />
15<br />
10<br />
139<br />
$ 2,936<br />
2010<br />
$ 313<br />
307<br />
293<br />
414<br />
338<br />
—<br />
227<br />
223<br />
67<br />
32<br />
20<br />
13<br />
6<br />
6<br />
9<br />
6<br />
4<br />
157<br />
6<br />
2,441<br />
71<br />
39<br />
14<br />
4<br />
128<br />
$ 2,569<br />
We received $316 million, $337 million, and $299 million of dividends from these affiliated companies for the years<br />
ended December 31, <strong>2011</strong>, 2010, and 2009, respectively.