5.3 Employment January 2012 Employment impacts were modeled using IMPLAN. Drilling and completi<strong>on</strong> expenditures were projected from forecasts provided by ICF, and presented in the following table. Total projected drilling and completi<strong>on</strong> expenditures are provided in the following table were mapped to IMPLAN sector 28 (drilling oil and gas wells) and sector 29 (support activities for oil and gas operati<strong>on</strong>s). <str<strong>on</strong>g>The</str<strong>on</strong>g> dollar value of producti<strong>on</strong> was mapped to IMPLAN sector 20 (oil and gas extracti<strong>on</strong>). Dollar denominated results are not adjusted for inflati<strong>on</strong>. For employment impacts, input expenditures were adjusted for inflati<strong>on</strong>. Employment impacts are reported as the number of full- and part-time jobs. TABLE 13 – Projected Drilling and Completi<strong>on</strong> Cost Per well, current dollars (not adjusted for inflati<strong>on</strong>) Year Colorado M<strong>on</strong>tana New Mexico North Dakota Utah Wyoming 2011 3,319,000 4,226,000 1,832,000 5,515,000 2,669,000 3,574,000 2012 3,603,000 4,815,000 2,099,000 5,816,000 2,803,000 4,125,000 2013 3,727,000 5,445,000 2,230,000 6,101,000 2,944,000 4,900,000 2014 3,860,000 5,408,000 2,295,000 5,986,000 3,017,000 4,866,000 2015 4,017,000 5,881,000 2,285,000 6,379,000 3,071,000 5,099,000 <str<strong>on</strong>g>The</str<strong>on</strong>g> costs per well were applied to projecti<strong>on</strong>s of the number of new wells drilled provided by the regressi<strong>on</strong> analysis (Table 5). Total projected drilling and completi<strong>on</strong> expenditures are provided in the following table. <str<strong>on</strong>g>The</str<strong>on</strong>g> costs per well were applied to projecti<strong>on</strong>s of the number of new wells drilled provided by the regressi<strong>on</strong> analysis (Table 5). Total projected drilling and completi<strong>on</strong> expenditures are provided in the following table. 38
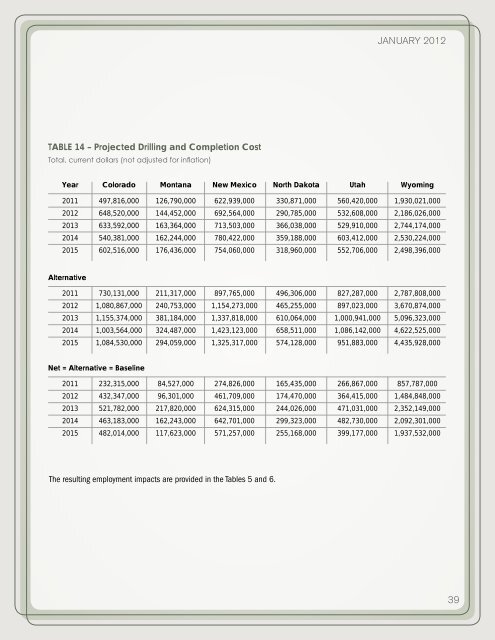
January 2012 TABLE 14 – Projected Drilling and Completi<strong>on</strong> Cost Total, current dollars (not adjusted for inflati<strong>on</strong>) Year Colorado M<strong>on</strong>tana New Mexico North Dakota Utah Wyoming 2011 497,816,000 126,790,000 622,939,000 330,871,000 560,420,000 1,930,021,000 2012 648,520,000 144,452,000 692,564,000 290,785,000 532,608,000 2,186,026,000 2013 633,592,000 163,364,000 713,503,000 366,038,000 529,910,000 2,744,174,000 2014 540,381,000 162,244,000 780,422,000 359,188,000 603,412,000 2,530,224,000 2015 602,516,000 176,436,000 754,060,000 318,960,000 552,706,000 2,498,396,000 Alternative 2011 730,131,000 211,317,000 897,765,000 496,306,000 827,287,000 2,787,808,000 2012 1,080,867,000 240,753,000 1,154,273,000 465,255,000 897,023,000 3,670,874,000 2013 1,155,374,000 381,184,000 1,337,818,000 610,064,000 1,000,941,000 5,096,323,000 2014 1,003,564,000 324,487,000 1,423,123,000 658,511,000 1,086,142,000 4,622,525,000 2015 1,084,530,000 294,059,000 1,325,317,000 574,128,000 951,883,000 4,435,928,000 Net = Alternative = Baseline 2011 232,315,000 84,527,000 274,826,000 165,435,000 266,867,000 857,787,000 2012 432,347,000 96,301,000 461,709,000 174,470,000 364,415,000 1,484,848,000 2013 521,782,000 217,820,000 624,315,000 244,026,000 471,031,000 2,352,149,000 2014 463,183,000 162,243,000 642,701,000 299,323,000 482,730,000 2,092,301,000 2015 482,014,000 117,623,000 571,257,000 255,168,000 399,177,000 1,937,532,000 <str<strong>on</strong>g>The</str<strong>on</strong>g> resulting employment impacts are provided in the Tables 5 and 6. 39
- Page 1 and 2:
Testimony House <s
- Page 3 and 4:
oost domestic production by four mi
- Page 5 and 6:
astonishing, with an estimated 17,0
- Page 7 and 8:
industry’s development costs thro
- Page 9 and 10:
Environmental Protection for Onshor
- Page 11 and 12:
Environmental Protection for Onshor
- Page 13 and 14:
ENVIRONMENTAL PROTECTION FOR ONSHOR
- Page 15 and 16:
ENVIRONMENTAL PROTECTION FOR ONSHOR
- Page 17 and 18:
ENVIRONMENTAL PROTECTION FOR ONSHOR
- Page 19 and 20:
ENVIRONMENTAL PROTECTION FOR ONSHOR
- Page 21 and 22:
ENVIRONMENTAL PROTECTION FOR ONSHOR
- Page 23 and 24:
ENVIRONMENTAL PROTECTION FOR ONSHOR
- Page 25 and 26:
ENVIRONMENTAL PROTECTION FOR ONSHOR
- Page 27 and 28:
ENVIRONMENTAL PROTECTION FOR ONSHOR
- Page 29 and 30:
ENVIRONMENTAL PROTECTION FOR ONSHOR
- Page 31 and 32:
ENVIRONMENTAL PROTECTION FOR ONSHOR
- Page 33 and 34:
ENVIRONMENTAL PROTECTION FOR ONSHOR
- Page 35 and 36:
ENVIRONMENTAL PROTECTION FOR ONSHOR
- Page 37 and 38:
ENVIRONMENTAL PROTECTION FOR ONSHOR
- Page 39 and 40:
ENVIRONMENTAL PROTECTION FOR ONSHOR
- Page 41 and 42:
ENVIRONMENTAL PROTECTION FOR ONSHOR
- Page 43 and 44:
ENVIRONMENTAL PROTECTION FOR ONSHOR
- Page 45 and 46:
ENVIRONMENTAL PROTECTION FOR ONSHOR
- Page 47 and 48:
ENVIRONMENTAL PROTECTION FOR ONSHOR
- Page 49 and 50:
ENVIRONMENTAL PROTECTION FOR ONSHOR
- Page 51:
Hydraulic Fracturing Operations—
- Page 54 and 55:
Special Notes API publications nece
- Page 57 and 58:
Contents 1 Scope . . . . . . . . .
- Page 59 and 60:
Hydraulic Fracturing Operations—W
- Page 61 and 62:
HYDRAULIC FRACTURING OPERATIONS—W
- Page 63 and 64:
HYDRAULIC FRACTURING OPERATIONS—W
- Page 65 and 66:
HYDRAULIC FRACTURING OPERATIONS—W
- Page 67 and 68:
HYDRAULIC FRACTURING OPERATIONS—W
- Page 69 and 70:
HYDRAULIC FRACTURING OPERATIONS—W
- Page 71 and 72:
HYDRAULIC FRACTURING OPERATIONS—W
- Page 73 and 74: HYDRAULIC FRACTURING OPERATIONS—W
- Page 75 and 76: HYDRAULIC FRACTURING OPERATIONS—W
- Page 77 and 78: HYDRAULIC FRACTURING OPERATIONS—W
- Page 79 and 80: HYDRAULIC FRACTURING OPERATIONS—W
- Page 81 and 82: Bibliography [1] Interstate Oil and
- Page 83 and 84: 2009 Publications Order Form Effect
- Page 86 and 87: 1220 L Street, NW Washington, DC 20
- Page 88 and 89: Contents January 2012 EXECUTIVE SUM
- Page 90 and 91: January 2012 EMPLOYMENT, GOVERNMENT
- Page 92 and 93: January 2012 These
- Page 94 and 95: January 2012 Figure 1: Natural Gas
- Page 96 and 97: 1.1 New Federal Drilling Leases Iss
- Page 98 and 99: 1.2 Permits to Drill: Down 39% Janu
- Page 100 and 101: 1.3 New Wells Drilled on Federal La
- Page 102 and 103: January 2012 2 ADVERSE FEDERAL LAND
- Page 104 and 105: January 2012 3 Economic Projections
- Page 106 and 107: 3.1 Overview of Baseline and Altern
- Page 108 and 109: January 2012 TABLE 3 - NET (Alterna
- Page 110 and 111: 3.3 January 2012 Increased Producti
- Page 112 and 113: January 2012 The n
- Page 114 and 115: January 2012 Figure 17: Total Emplo
- Page 116 and 117: January 2012 Table 9 shows what the
- Page 118 and 119: January 2012 4 CONCLUSION T
- Page 120 and 121: January 2012 5 APPENDIX: Data and M
- Page 122 and 123: TABLE 11 - Baseline and Alternative
- Page 126 and 127: 5.4 State Severance and Ad Valorem
- Page 128 and 129: Natural Gas Production, billion cub
- Page 130 and 131: Number of Wells Started (Spud) on F
- Page 132 and 133: Net (Alternative Minus Baseline) Ja
- Page 134 and 135: Net (Alternative Minus Baseline) Ja
- Page 136 and 137: Federal royalties of production of
- Page 138 and 139: Imports from Rest of the World 38%
- Page 144: Water Management Associated with Hy
- Page 147 and 148: Special Notes API publications nece
- Page 150: Contents Executive Summary . . . .
- Page 153 and 154: considerations). A hierarchy of pot
- Page 155 and 156: 2 API GUIDANCE DOCUMENT HF2 2.8 flo
- Page 157 and 158: 4 API GUIDANCE DOCUMENT HF2 2.30 so
- Page 159 and 160: 6 API GUIDANCE DOCUMENT HF2 As deve
- Page 161 and 162: 8 API GUIDANCE DOCUMENT HF2 Typical
- Page 163 and 164: 10 API GUIDANCE DOCUMENT HF2 — St
- Page 165 and 166: 12 API GUIDANCE DOCUMENT HF2 seques
- Page 167 and 168: 14 API GUIDANCE DOCUMENT HF2 6.2.1
- Page 169 and 170: 16 API GUIDANCE DOCUMENT HF2 6.2.2
- Page 171 and 172: 18 API GUIDANCE DOCUMENT HF2 fractu
- Page 173 and 174: 20 API GUIDANCE DOCUMENT HF2 — av
- Page 175 and 176:
22 API GUIDANCE DOCUMENT HF2 <stron
- Page 177 and 178:
Bibliography [1] American Petroleum
- Page 179 and 180:
26 API GUIDANCE DOCUMENT HF2 [32] H
- Page 181:
THERE’S MORE WHERE THIS CAME FROM
- Page 184:
Practices for Mitigating Surface Im
- Page 187 and 188:
Special Notes API publications nece
- Page 190:
Contents Executive Summary . . . .
- Page 193 and 194:
proactive in communicating to, and
- Page 196 and 197:
Practices for Mitigating Surface Im
- Page 198 and 199:
PRACTICES FOR MITIGATING SURFACE IM
- Page 200 and 201:
PRACTICES FOR MITIGATING SURFACE IM
- Page 202 and 203:
PRACTICES FOR MITIGATING SURFACE IM
- Page 204 and 205:
PRACTICES FOR MITIGATING SURFACE IM
- Page 206 and 207:
PRACTICES FOR MITIGATING SURFACE IM
- Page 208 and 209:
PRACTICES FOR MITIGATING SURFACE IM
- Page 210 and 211:
PRACTICES FOR MITIGATING SURFACE IM
- Page 212 and 213:
PRACTICES FOR MITIGATING SURFACE IM
- Page 214 and 215:
2010 PUBLICATIONS ORDER FORM Effect
- Page 217 and 218:
Product No. GHF301
- Page 219 and 220:
www.woodmac.com Project Background
- Page 221 and 222:
www.woodmac.com Key Results ACCESS
- Page 223 and 224:
www.woodmac.com Scope of Study - Ac
- Page 225 and 226:
www.woodmac.com Methodology Access
- Page 227 and 228:
www.woodmac.com Methodology Access
- Page 229 and 230:
www.woodmac.com Access Scenario - E
- Page 231 and 232:
www.woodmac.com 2 Increased Tax Sce
- Page 233 and 234:
www.woodmac.com Methodology - Tax S
- Page 235 and 236:
www.woodmac.com Results Taxes Scena
- Page 237 and 238:
www.woodmac.com Tax Scenarios - Est
- Page 239 and 240:
www.woodmac.com Tax Scenarios - Gov
- Page 241 and 242:
www.woodmac.com Access Scenario - R
- Page 243 and 244:
www.woodmac.com Access Scenario - L
- Page 245 and 246:
www.woodmac.com Tax Scenario - Base
- Page 247 and 248:
www.woodmac.com Tax Scenarios - Pro
- Page 249 and 250:
www.woodmac.com Access Scenario - E
- Page 251 and 252:
www.woodmac.com Access Scenario - V
- Page 253 and 254:
www.woodmac.com Tax Scenario - Esti
- Page 255 and 256:
Tax Scenario - Estimated Impacts on
- Page 257 and 258:
www.woodmac.com Wood Mackenzie Disc
- Page 259:
Isolating Potential Flow Zones Duri
- Page 262 and 263:
Special Notes API publications nece
- Page 265 and 266:
Contents 1 Scope . . . . . . . . .
- Page 267 and 268:
Isolating Potential Flow Zones Duri
- Page 269 and 270:
ISOLATING POTENTIAL FLOW ZONES DURI
- Page 271 and 272:
ISOLATING POTENTIAL FLOW ZONES DURI
- Page 273 and 274:
ISOLATING POTENTIAL FLOW ZONES DURI
- Page 275 and 276:
ISOLATING POTENTIAL FLOW ZONES DURI
- Page 277 and 278:
ISOLATING POTENTIAL FLOW ZONES DURI
- Page 279 and 280:
ISOLATING POTENTIAL FLOW ZONES DURI
- Page 281 and 282:
ISOLATING POTENTIAL FLOW ZONES DURI
- Page 283 and 284:
ISOLATING POTENTIAL FLOW ZONES DURI
- Page 285 and 286:
ISOLATING POTENTIAL FLOW ZONES DURI
- Page 287 and 288:
ISOLATING POTENTIAL FLOW ZONES DURI
- Page 289 and 290:
ISOLATING POTENTIAL FLOW ZONES DURI
- Page 291 and 292:
ISOLATING POTENTIAL FLOW ZONES DURI
- Page 293 and 294:
ISOLATING POTENTIAL FLOW ZONES DURI
- Page 295 and 296:
ISOLATING POTENTIAL FLOW ZONES DURI
- Page 297 and 298:
ISOLATING POTENTIAL FLOW ZONES DURI
- Page 299 and 300:
ISOLATING POTENTIAL FLOW ZONES DURI
- Page 301 and 302:
ISOLATING POTENTIAL FLOW ZONES DURI
- Page 303 and 304:
ISOLATING POTENTIAL FLOW ZONES DURI
- Page 305 and 306:
ISOLATING POTENTIAL FLOW ZONES DURI
- Page 307 and 308:
ISOLATING POTENTIAL FLOW ZONES DURI
- Page 309 and 310:
ISOLATING POTENTIAL FLOW ZONES DURI
- Page 311 and 312:
ISOLATING POTENTIAL FLOW ZONES DURI
- Page 313 and 314:
ISOLATING POTENTIAL FLOW ZONES DURI
- Page 315 and 316:
ISOLATING POTENTIAL FLOW ZONES DURI
- Page 317 and 318:
ISOLATING POTENTIAL FLOW ZONES DURI
- Page 319 and 320:
ISOLATING POTENTIAL FLOW ZONES DURI
- Page 321 and 322:
ISOLATING POTENTIAL FLOW ZONES DURI
- Page 323 and 324:
ISOLATING POTENTIAL FLOW ZONES DURI
- Page 325 and 326:
Annex B (informative) Well Planning
- Page 327 and 328:
ISOLATING POTENTIAL FLOW ZONES DURI
- Page 329 and 330:
ISOLATING POTENTIAL FLOW ZONES DURI
- Page 331 and 332:
ISOLATING POTENTIAL FLOW ZONES DURI
- Page 333 and 334:
ISOLATING POTENTIAL FLOW ZONES DURI
- Page 335 and 336:
ISOLATING POTENTIAL FLOW ZONES DURI
- Page 337 and 338:
ISOLATING POTENTIAL FLOW ZONES DURI
- Page 339 and 340:
ISOLATING POTENTIAL FLOW ZONES DURI
- Page 341 and 342:
Annex D 1 (normative) Process Summa
- Page 343 and 344:
ISOLATING POTENTIAL FLOW ZONES DURI
- Page 345 and 346:
ISOLATING POTENTIAL FLOW ZONES DURI
- Page 347 and 348:
Bibliography [1] Gai, H., Walz, G.,
- Page 349:
ISOLATING POTENTIAL FLOW ZONES DURI
- Page 352:
THERE’S MORE WHERE THIS CAME FROM
- Page 355 and 356:
Economic Impacts of Oil and Gas Dev
- Page 357 and 358:
Economic Impacts of Oil and Gas Dev
- Page 359 and 360:
Economic Impacts of Oil and Gas Dev
- Page 361 and 362:
Economic Impacts of Oil and Gas Dev
- Page 363 and 364:
Economic Impacts of Oil and Gas Dev
- Page 365 and 366:
Economic Impacts of Oil and Gas Dev
- Page 367 and 368:
Economic Impacts of Oil and Gas Dev
- Page 369 and 370:
Economic Impacts of Oil and Gas Dev
- Page 371 and 372:
Administration energy strategy is n
- Page 373 and 374:
2012 Administration raises the min
- Page 375 and 376:
www.woodmac.com Study Background AP
- Page 377 and 378:
Jobs 2010 2011 2012 2013 2014 2015
- Page 379 and 380:
www.woodmac.com Key State Results (
- Page 381 and 382:
www.woodmac.com Case Development
- Page 383 and 384:
www.woodmac.com Current Path Case -
- Page 385 and 386:
www.woodmac.com Development Policy
- Page 387 and 388:
30°N 45°N 15°N 45°N 30°N 15°N
- Page 389 and 390:
www.woodmac.com Scenario Modeling
- Page 391 and 392:
www.woodmac.com Methodology - Emplo
- Page 393 and 394:
Methodology - Employment Estimation
- Page 395 and 396:
www.woodmac.com Gulf of Mexico and
- Page 397 and 398:
www.woodmac.com Contents 1 2 Scenar
- Page 399 and 400:
mmboed 2010 2011 2012 2013 2014 201
- Page 401 and 402:
Jobs 2012 2013 2014 2015 2016 2017
- Page 403 and 404:
$Billion per year 2012 2013 2014 20
- Page 405 and 406:
Jobs 2012 2013 2014 2015 2016 2017
- Page 407 and 408:
$Billion 2012 2013 2014 2015 2016 2
- Page 409 and 410:
Jobs 2012 2013 2014 2015 2016 2017
- Page 411 and 412:
Jobs 2012 2013 2014 2015 2016 2017
- Page 413 and 414:
www.woodmac.com Contents 1 2 Scenar
- Page 415 and 416:
Development Policy Case - Annual Jo
- Page 417 and 418:
www.woodmac.com Projected Results b
- Page 419 and 420:
www.woodmac.com Projected Results b
- Page 421 and 422:
www.woodmac.com Projected Results b
- Page 423 and 424:
www.woodmac.com Projected Results b
- Page 425 and 426:
www.woodmac.com Projected Results b
- Page 427 and 428:
www.woodmac.com Tax Assumptions •
- Page 429 and 430:
www.woodmac.com Wood Mackenzie Disc