- Page 1 and 2:
Testimony House <s
- Page 3 and 4:
oost domestic production by four mi
- Page 5 and 6:
astonishing, with an estimated 17,0
- Page 7 and 8:
industry’s development costs thro
- Page 9 and 10:
Environmental Protection for Onshor
- Page 11 and 12:
Environmental Protection for Onshor
- Page 13 and 14:
ENVIRONMENTAL PROTECTION FOR ONSHOR
- Page 15 and 16:
ENVIRONMENTAL PROTECTION FOR ONSHOR
- Page 17 and 18:
ENVIRONMENTAL PROTECTION FOR ONSHOR
- Page 19 and 20:
ENVIRONMENTAL PROTECTION FOR ONSHOR
- Page 21 and 22:
ENVIRONMENTAL PROTECTION FOR ONSHOR
- Page 23 and 24:
ENVIRONMENTAL PROTECTION FOR ONSHOR
- Page 25 and 26:
ENVIRONMENTAL PROTECTION FOR ONSHOR
- Page 27 and 28:
ENVIRONMENTAL PROTECTION FOR ONSHOR
- Page 29 and 30:
ENVIRONMENTAL PROTECTION FOR ONSHOR
- Page 31 and 32:
ENVIRONMENTAL PROTECTION FOR ONSHOR
- Page 33 and 34:
ENVIRONMENTAL PROTECTION FOR ONSHOR
- Page 35 and 36:
ENVIRONMENTAL PROTECTION FOR ONSHOR
- Page 37 and 38:
ENVIRONMENTAL PROTECTION FOR ONSHOR
- Page 39 and 40: ENVIRONMENTAL PROTECTION FOR ONSHOR
- Page 41 and 42: ENVIRONMENTAL PROTECTION FOR ONSHOR
- Page 43 and 44: ENVIRONMENTAL PROTECTION FOR ONSHOR
- Page 45 and 46: ENVIRONMENTAL PROTECTION FOR ONSHOR
- Page 47 and 48: ENVIRONMENTAL PROTECTION FOR ONSHOR
- Page 49 and 50: ENVIRONMENTAL PROTECTION FOR ONSHOR
- Page 51: Hydraulic Fracturing Operations—
- Page 54 and 55: Special Notes API publications nece
- Page 57 and 58: Contents 1 Scope . . . . . . . . .
- Page 59 and 60: Hydraulic Fracturing Operations—W
- Page 61 and 62: HYDRAULIC FRACTURING OPERATIONS—W
- Page 63 and 64: HYDRAULIC FRACTURING OPERATIONS—W
- Page 65 and 66: HYDRAULIC FRACTURING OPERATIONS—W
- Page 67 and 68: HYDRAULIC FRACTURING OPERATIONS—W
- Page 69 and 70: HYDRAULIC FRACTURING OPERATIONS—W
- Page 71 and 72: HYDRAULIC FRACTURING OPERATIONS—W
- Page 73 and 74: HYDRAULIC FRACTURING OPERATIONS—W
- Page 75 and 76: HYDRAULIC FRACTURING OPERATIONS—W
- Page 77 and 78: HYDRAULIC FRACTURING OPERATIONS—W
- Page 79 and 80: HYDRAULIC FRACTURING OPERATIONS—W
- Page 81 and 82: Bibliography [1] Interstate Oil and
- Page 83 and 84: 2009 Publications Order Form Effect
- Page 86 and 87: 1220 L Street, NW Washington, DC 20
- Page 88 and 89: Contents January 2012 EXECUTIVE SUM
- Page 92 and 93: January 2012 These
- Page 94 and 95: January 2012 Figure 1: Natural Gas
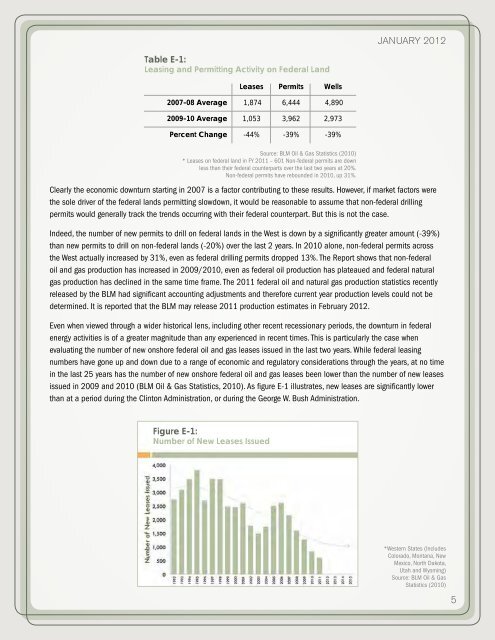
- Page 96 and 97: 1.1 New Federal Drilling Leases Iss
- Page 98 and 99: 1.2 Permits to Drill: Down 39% Janu
- Page 100 and 101: 1.3 New Wells Drilled on Federal La
- Page 102 and 103: January 2012 2 ADVERSE FEDERAL LAND
- Page 104 and 105: January 2012 3 Economic Projections
- Page 106 and 107: 3.1 Overview of Baseline and Altern
- Page 108 and 109: January 2012 TABLE 3 - NET (Alterna
- Page 110 and 111: 3.3 January 2012 Increased Producti
- Page 112 and 113: January 2012 The n
- Page 114 and 115: January 2012 Figure 17: Total Emplo
- Page 116 and 117: January 2012 Table 9 shows what the
- Page 118 and 119: January 2012 4 CONCLUSION T
- Page 120 and 121: January 2012 5 APPENDIX: Data and M
- Page 122 and 123: TABLE 11 - Baseline and Alternative
- Page 124 and 125: 5.3 Employment January 2012 Employm
- Page 126 and 127: 5.4 State Severance and Ad Valorem
- Page 128 and 129: Natural Gas Production, billion cub
- Page 130 and 131: Number of Wells Started (Spud) on F
- Page 132 and 133: Net (Alternative Minus Baseline) Ja
- Page 134 and 135: Net (Alternative Minus Baseline) Ja
- Page 136 and 137: Federal royalties of production of
- Page 138 and 139: Imports from Rest of the World 38%
- Page 144:
Water Management Associated with Hy
- Page 147 and 148:
Special Notes API publications nece
- Page 150:
Contents Executive Summary . . . .
- Page 153 and 154:
considerations). A hierarchy of pot
- Page 155 and 156:
2 API GUIDANCE DOCUMENT HF2 2.8 flo
- Page 157 and 158:
4 API GUIDANCE DOCUMENT HF2 2.30 so
- Page 159 and 160:
6 API GUIDANCE DOCUMENT HF2 As deve
- Page 161 and 162:
8 API GUIDANCE DOCUMENT HF2 Typical
- Page 163 and 164:
10 API GUIDANCE DOCUMENT HF2 — St
- Page 165 and 166:
12 API GUIDANCE DOCUMENT HF2 seques
- Page 167 and 168:
14 API GUIDANCE DOCUMENT HF2 6.2.1
- Page 169 and 170:
16 API GUIDANCE DOCUMENT HF2 6.2.2
- Page 171 and 172:
18 API GUIDANCE DOCUMENT HF2 fractu
- Page 173 and 174:
20 API GUIDANCE DOCUMENT HF2 — av
- Page 175 and 176:
22 API GUIDANCE DOCUMENT HF2 <stron
- Page 177 and 178:
Bibliography [1] American Petroleum
- Page 179 and 180:
26 API GUIDANCE DOCUMENT HF2 [32] H
- Page 181:
THERE’S MORE WHERE THIS CAME FROM
- Page 184:
Practices for Mitigating Surface Im
- Page 187 and 188:
Special Notes API publications nece
- Page 190:
Contents Executive Summary . . . .
- Page 193 and 194:
proactive in communicating to, and
- Page 196 and 197:
Practices for Mitigating Surface Im
- Page 198 and 199:
PRACTICES FOR MITIGATING SURFACE IM
- Page 200 and 201:
PRACTICES FOR MITIGATING SURFACE IM
- Page 202 and 203:
PRACTICES FOR MITIGATING SURFACE IM
- Page 204 and 205:
PRACTICES FOR MITIGATING SURFACE IM
- Page 206 and 207:
PRACTICES FOR MITIGATING SURFACE IM
- Page 208 and 209:
PRACTICES FOR MITIGATING SURFACE IM
- Page 210 and 211:
PRACTICES FOR MITIGATING SURFACE IM
- Page 212 and 213:
PRACTICES FOR MITIGATING SURFACE IM
- Page 214 and 215:
2010 PUBLICATIONS ORDER FORM Effect
- Page 217 and 218:
Product No. GHF301
- Page 219 and 220:
www.woodmac.com Project Background
- Page 221 and 222:
www.woodmac.com Key Results ACCESS
- Page 223 and 224:
www.woodmac.com Scope of Study - Ac
- Page 225 and 226:
www.woodmac.com Methodology Access
- Page 227 and 228:
www.woodmac.com Methodology Access
- Page 229 and 230:
www.woodmac.com Access Scenario - E
- Page 231 and 232:
www.woodmac.com 2 Increased Tax Sce
- Page 233 and 234:
www.woodmac.com Methodology - Tax S
- Page 235 and 236:
www.woodmac.com Results Taxes Scena
- Page 237 and 238:
www.woodmac.com Tax Scenarios - Est
- Page 239 and 240:
www.woodmac.com Tax Scenarios - Gov
- Page 241 and 242:
www.woodmac.com Access Scenario - R
- Page 243 and 244:
www.woodmac.com Access Scenario - L
- Page 245 and 246:
www.woodmac.com Tax Scenario - Base
- Page 247 and 248:
www.woodmac.com Tax Scenarios - Pro
- Page 249 and 250:
www.woodmac.com Access Scenario - E
- Page 251 and 252:
www.woodmac.com Access Scenario - V
- Page 253 and 254:
www.woodmac.com Tax Scenario - Esti
- Page 255 and 256:
Tax Scenario - Estimated Impacts on
- Page 257 and 258:
www.woodmac.com Wood Mackenzie Disc
- Page 259:
Isolating Potential Flow Zones Duri
- Page 262 and 263:
Special Notes API publications nece
- Page 265 and 266:
Contents 1 Scope . . . . . . . . .
- Page 267 and 268:
Isolating Potential Flow Zones Duri
- Page 269 and 270:
ISOLATING POTENTIAL FLOW ZONES DURI
- Page 271 and 272:
ISOLATING POTENTIAL FLOW ZONES DURI
- Page 273 and 274:
ISOLATING POTENTIAL FLOW ZONES DURI
- Page 275 and 276:
ISOLATING POTENTIAL FLOW ZONES DURI
- Page 277 and 278:
ISOLATING POTENTIAL FLOW ZONES DURI
- Page 279 and 280:
ISOLATING POTENTIAL FLOW ZONES DURI
- Page 281 and 282:
ISOLATING POTENTIAL FLOW ZONES DURI
- Page 283 and 284:
ISOLATING POTENTIAL FLOW ZONES DURI
- Page 285 and 286:
ISOLATING POTENTIAL FLOW ZONES DURI
- Page 287 and 288:
ISOLATING POTENTIAL FLOW ZONES DURI
- Page 289 and 290:
ISOLATING POTENTIAL FLOW ZONES DURI
- Page 291 and 292:
ISOLATING POTENTIAL FLOW ZONES DURI
- Page 293 and 294:
ISOLATING POTENTIAL FLOW ZONES DURI
- Page 295 and 296:
ISOLATING POTENTIAL FLOW ZONES DURI
- Page 297 and 298:
ISOLATING POTENTIAL FLOW ZONES DURI
- Page 299 and 300:
ISOLATING POTENTIAL FLOW ZONES DURI
- Page 301 and 302:
ISOLATING POTENTIAL FLOW ZONES DURI
- Page 303 and 304:
ISOLATING POTENTIAL FLOW ZONES DURI
- Page 305 and 306:
ISOLATING POTENTIAL FLOW ZONES DURI
- Page 307 and 308:
ISOLATING POTENTIAL FLOW ZONES DURI
- Page 309 and 310:
ISOLATING POTENTIAL FLOW ZONES DURI
- Page 311 and 312:
ISOLATING POTENTIAL FLOW ZONES DURI
- Page 313 and 314:
ISOLATING POTENTIAL FLOW ZONES DURI
- Page 315 and 316:
ISOLATING POTENTIAL FLOW ZONES DURI
- Page 317 and 318:
ISOLATING POTENTIAL FLOW ZONES DURI
- Page 319 and 320:
ISOLATING POTENTIAL FLOW ZONES DURI
- Page 321 and 322:
ISOLATING POTENTIAL FLOW ZONES DURI
- Page 323 and 324:
ISOLATING POTENTIAL FLOW ZONES DURI
- Page 325 and 326:
Annex B (informative) Well Planning
- Page 327 and 328:
ISOLATING POTENTIAL FLOW ZONES DURI
- Page 329 and 330:
ISOLATING POTENTIAL FLOW ZONES DURI
- Page 331 and 332:
ISOLATING POTENTIAL FLOW ZONES DURI
- Page 333 and 334:
ISOLATING POTENTIAL FLOW ZONES DURI
- Page 335 and 336:
ISOLATING POTENTIAL FLOW ZONES DURI
- Page 337 and 338:
ISOLATING POTENTIAL FLOW ZONES DURI
- Page 339 and 340:
ISOLATING POTENTIAL FLOW ZONES DURI
- Page 341 and 342:
Annex D 1 (normative) Process Summa
- Page 343 and 344:
ISOLATING POTENTIAL FLOW ZONES DURI
- Page 345 and 346:
ISOLATING POTENTIAL FLOW ZONES DURI
- Page 347 and 348:
Bibliography [1] Gai, H., Walz, G.,
- Page 349:
ISOLATING POTENTIAL FLOW ZONES DURI
- Page 352:
THERE’S MORE WHERE THIS CAME FROM
- Page 355 and 356:
Economic Impacts of Oil and Gas Dev
- Page 357 and 358:
Economic Impacts of Oil and Gas Dev
- Page 359 and 360:
Economic Impacts of Oil and Gas Dev
- Page 361 and 362:
Economic Impacts of Oil and Gas Dev
- Page 363 and 364:
Economic Impacts of Oil and Gas Dev
- Page 365 and 366:
Economic Impacts of Oil and Gas Dev
- Page 367 and 368:
Economic Impacts of Oil and Gas Dev
- Page 369 and 370:
Economic Impacts of Oil and Gas Dev
- Page 371 and 372:
Administration energy strategy is n
- Page 373 and 374:
2012 Administration raises the min
- Page 375 and 376:
www.woodmac.com Study Background AP
- Page 377 and 378:
Jobs 2010 2011 2012 2013 2014 2015
- Page 379 and 380:
www.woodmac.com Key State Results (
- Page 381 and 382:
www.woodmac.com Case Development
- Page 383 and 384:
www.woodmac.com Current Path Case -
- Page 385 and 386:
www.woodmac.com Development Policy
- Page 387 and 388:
30°N 45°N 15°N 45°N 30°N 15°N
- Page 389 and 390:
www.woodmac.com Scenario Modeling
- Page 391 and 392:
www.woodmac.com Methodology - Emplo
- Page 393 and 394:
Methodology - Employment Estimation
- Page 395 and 396:
www.woodmac.com Gulf of Mexico and
- Page 397 and 398:
www.woodmac.com Contents 1 2 Scenar
- Page 399 and 400:
mmboed 2010 2011 2012 2013 2014 201
- Page 401 and 402:
Jobs 2012 2013 2014 2015 2016 2017
- Page 403 and 404:
$Billion per year 2012 2013 2014 20
- Page 405 and 406:
Jobs 2012 2013 2014 2015 2016 2017
- Page 407 and 408:
$Billion 2012 2013 2014 2015 2016 2
- Page 409 and 410:
Jobs 2012 2013 2014 2015 2016 2017
- Page 411 and 412:
Jobs 2012 2013 2014 2015 2016 2017
- Page 413 and 414:
www.woodmac.com Contents 1 2 Scenar
- Page 415 and 416:
Development Policy Case - Annual Jo
- Page 417 and 418:
www.woodmac.com Projected Results b
- Page 419 and 420:
www.woodmac.com Projected Results b
- Page 421 and 422:
www.woodmac.com Projected Results b
- Page 423 and 424:
www.woodmac.com Projected Results b
- Page 425 and 426:
www.woodmac.com Projected Results b
- Page 427 and 428:
www.woodmac.com Tax Assumptions •
- Page 429 and 430:
www.woodmac.com Wood Mackenzie Disc