Mr. Erik Milito - The House Committee on Natural Resources ...
Mr. Erik Milito - The House Committee on Natural Resources ...
Mr. Erik Milito - The House Committee on Natural Resources ...

You also want an ePaper? Increase the reach of your titles
YUMPU automatically turns print PDFs into web optimized ePapers that Google loves.
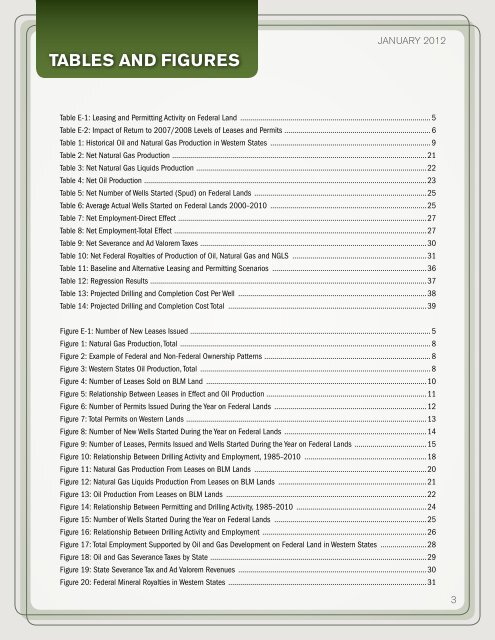
Tables and FIGURES<br />
January 2012<br />
Table E-1: Leasing and Permitting Activity <strong>on</strong> Federal Land ................................................................................................ 5<br />
Table E-2: Impact of Return to 2007/2008 Levels of Leases and Permits ......................................................................... 6<br />
Table 1: Historical Oil and <strong>Natural</strong> Gas Producti<strong>on</strong> in Western States ................................................................................. 9<br />
Table 2: Net <strong>Natural</strong> Gas Producti<strong>on</strong> ................................................................................................................................21<br />
Table 3: Net <strong>Natural</strong> Gas Liquids Producti<strong>on</strong> ....................................................................................................................22<br />
Table 4: Net Oil Producti<strong>on</strong> ..............................................................................................................................................23<br />
Table 5: Net Number of Wells Started (Spud) <strong>on</strong> Federal Lands .......................................................................................25<br />
Table 6: Average Actual Wells Started <strong>on</strong> Federal Lands 2000–2010 ...............................................................................25<br />
Table 7: Net Employment-Direct Effect .............................................................................................................................27<br />
Table 8: Net Employment-Total Effect ...............................................................................................................................27<br />
Table 9: Net Severance and Ad Valorem Taxes ..................................................................................................................30<br />
Table 10: Net Federal Royalties of Producti<strong>on</strong> of Oil, <strong>Natural</strong> Gas and NGLS ....................................................................31<br />
Table 11: Baseline and Alternative Leasing and Permitting Scenarios ..............................................................................36<br />
Table 12: Regressi<strong>on</strong> Results ...........................................................................................................................................37<br />
Table 13: Projected Drilling and Completi<strong>on</strong> Cost Per Well ...............................................................................................38<br />
Table 14: Projected Drilling and Completi<strong>on</strong> Cost Total ....................................................................................................39<br />
Figure E-1: Number of New Leases Issued ......................................................................................................................... 5<br />
Figure 1: <strong>Natural</strong> Gas Producti<strong>on</strong>, Total .............................................................................................................................. 8<br />
Figure 2: Example of Federal and N<strong>on</strong>-Federal Ownership Patterns .................................................................................... 8<br />
Figure 3: Western States Oil Producti<strong>on</strong>, Total .................................................................................................................... 8<br />
Figure 4: Number of Leases Sold <strong>on</strong> BLM Land ...............................................................................................................10<br />
Figure 5: Relati<strong>on</strong>ship Between Leases in Effect and Oil Producti<strong>on</strong> ................................................................................11<br />
Figure 6: Number of Permits Issued During the Year <strong>on</strong> Federal Lands .............................................................................12<br />
Figure 7: Total Permits <strong>on</strong> Western Lands .........................................................................................................................13<br />
Figure 8: Number of New Wells Started During the Year <strong>on</strong> Federal Lands ........................................................................14<br />
Figure 9: Number of Leases, Permits Issued and Wells Started During the Year <strong>on</strong> Federal Lands .....................................15<br />
Figure 10: Relati<strong>on</strong>ship Between Drilling Activity and Employment, 1985–2010 ..............................................................18<br />
Figure 11: <strong>Natural</strong> Gas Producti<strong>on</strong> From Leases <strong>on</strong> BLM Lands .......................................................................................20<br />
Figure 12: <strong>Natural</strong> Gas Liquids Producti<strong>on</strong> From Leases <strong>on</strong> BLM Lands ...........................................................................21<br />
Figure 13: Oil Producti<strong>on</strong> From Leases <strong>on</strong> BLM Lands .....................................................................................................22<br />
Figure 14: Relati<strong>on</strong>ship Between Permitting and Drilling Activity, 1985–2010 ..................................................................24<br />
Figure 15: Number of Wells Started During the Year <strong>on</strong> Federal Lands .............................................................................25<br />
Figure 16: Relati<strong>on</strong>ship Between Drilling Activity and Employment ...................................................................................26<br />
Figure 17: Total Employment Supported by Oil and Gas Development <strong>on</strong> Federal Land in Western States ........................28<br />
Figure 18: Oil and Gas Severance Taxes by State .............................................................................................................29<br />
Figure 19: State Severance Tax and Ad Valorem Revenues ...............................................................................................30<br />
Figure 20: Federal Mineral Royalties in Western States ....................................................................................................31<br />
3