- Page 1 and 2:
Life - a user’s manual Part II Gu
- Page 3 and 4:
Index Part II Society..............
- Page 5 and 6:
”Damage” on legal art Pustgrän
- Page 7 and 8:
Ekelund bridge Central bridge 7
- Page 9 and 10:
Knitted ”damage” At slussen Hor
- Page 11 and 12:
Legal och illegal Three dimensional
- Page 13 and 14:
Torsgatan Tegnérgatan 13
- Page 15 and 16:
Fatbursparken Hornsgatan Dalagatan
- Page 17 and 18:
It may seem as if the children in t
- Page 19 and 20:
In the spring, it was common for bo
- Page 21 and 22:
At the time of potato harvesting we
- Page 23 and 24:
When we became so grown up that we
- Page 25 and 26:
Another game called "Draga klönhan
- Page 27 and 28:
Sometimes we competed in agility to
- Page 29 and 30:
If we happened to have a ladder we
- Page 31 and 32:
Pawn games, as "Mary's purse" were
- Page 33 and 34:
Suspended sentence Courts may choos
- Page 35 and 36:
The economy of crime Shoplifting an
- Page 37 and 38:
Burglary in boats Coming to boats t
- Page 39 and 40:
Alcohol and drug related crimes Alc
- Page 41 and 42:
Traffic offenses As seen in table 7
- Page 43 and 44:
Get accomodation in Stockholm The p
- Page 45 and 46:
Building a house It may be cheaper
- Page 47 and 48: Rent an office I have, a few times,
- Page 49 and 50: Renting part of a dwelling "inheren
- Page 51 and 52: Contact property owner Several peop
- Page 53 and 54: Buying condominium The buyer of a c
- Page 55 and 56: Buying a caravan To live in a carav
- Page 57 and 58: Table 19 b Example of villas in the
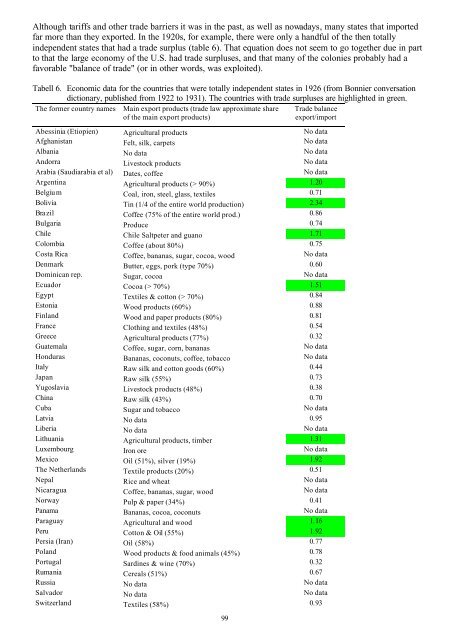
- Page 59 and 60: Although the concept possibly is un
- Page 61 and 62: A potential benefit of having somet
- Page 63 and 64: Another example that suggests this
- Page 65 and 66: Twenty years later, most had centra
- Page 67 and 68: But when a number of occupations we
- Page 69 and 70: Political ideologies Political ideo
- Page 71 and 72: Household economy = If all children
- Page 73 and 74: 500 years later, the Roman Empire f
- Page 75 and 76: English, French and Dutch conqueror
- Page 77 and 78: Table 1. When the countries that ex
- Page 79 and 80: Malawi 1964 British colony / protec
- Page 81 and 82: Demographic trends The year 0, ther
- Page 83 and 84: Hungary 92 900 8,4 90,42 9,34 10,21
- Page 85 and 86: Malaysia 6.11 23.27 5 8 573 120 2.1
- Page 87 and 88: The long route to today's political
- Page 89 and 90: - For economic stability and aid th
- Page 91 and 92: State revenues In the Middle Ages,
- Page 93 and 94: Over time, increased government tax
- Page 95 and 96: 40,0 Governement taxes and social f
- Page 97: The most important import goods to
- Page 101 and 102: In addition to these currencies we
- Page 103 and 104: Government expenditure State affair
- Page 105 and 106: Defence Owning weapons and to be fa
- Page 107 and 108: With the population growth in the l
- Page 109 and 110: The Swedish judicial system has rou
- Page 111 and 112: The end of the 1800s At the end of
- Page 113 and 114: Many ads, in particular those about
- Page 115 and 116: Mora daily 1915 Bank & finance Cand
- Page 117 and 118: Borås tidning, 1930 Movies Health
- Page 119 and 120: Barometern, 1935 Beverages Health p
- Page 121 and 122: Hudiksvallsposten, 1940 Building ma
- Page 123 and 124: Jämtlandstidningen, 1945 Jämtland
- Page 125 and 126: Örebrokuriren, 1950 Building mater
- Page 127 and 128: The total country side press 4 , 19
- Page 129 and 130: References Gröndal T (1991) Reklam
- Page 131 and 132: Geography Differences between count
- Page 133 and 134: Regarding other factors, like how l
- Page 135 and 136: Estonia 99 95 5 6 123 4,1 9 392 Eth
- Page 137 and 138: Sierra Leone 86 13 35 3 34 1,4 463
- Page 139 and 140: Estonia 85 444 15,6 1 Estonian Kroo
- Page 141 and 142: Sierra Leone 18 5 9,7 4 English Leo
- Page 143 and 144: Tabell 5a. Natural Resources in rel
- Page 145 and 146: Gabon Gambia Georgia Ghana Greece B
- Page 147 and 148: Mali Malta Morocco Mauritania Mauri
- Page 149 and 150:
Somalia Spain Sri Lanka UK Sudan Su
- Page 151 and 152:
Bahamas 1 51 6 126 27 98 3,7 82 17
- Page 153 and 154:
Lichtenstein 19 44 0 Lithuania 33 3
- Page 155 and 156:
Uruguay 11 10 5 104 26 100 5,9 8 87
- Page 157 and 158:
Equatorial Flat with coast. 25 54 G
- Page 159 and 160:
St. Kitts and Nevis St Lucia St. Vi
- Page 161 and 162:
Dem Rep of 80 23 2 17 - 5 4 5 20 60
- Page 163 and 164:
Russia 98 87 5 2 166 4 245 16 121 2
- Page 165 and 166:
Type one hundred years after Buddha
- Page 167 and 168:
In 1154 Burma's pride, the then Hin
- Page 169 and 170:
Religions create some obvious diffe
- Page 171 and 172:
Ghana 13 5 4 4 71 33 3 19 23 1 920
- Page 173 and 174:
Vanuatu 52 5 4 3 119 1 38 27 3 127
- Page 175 and 176:
Estonia 99 95 5 6 123 4 444 16 167
- Page 177 and 178:
Sri Lanka 95 98 91 20 3 83 2 58 1 8
- Page 179 and 180:
An important question to ask yourse
- Page 181 and 182:
As a, personal assistant to a handi
- Page 183 and 184:
9 8 7 6 5 4 3 2 Control over the wo
- Page 185 and 186:
Table 1. Grading of a number of wor
- Page 187 and 188:
Organized meetings Another phenomen
- Page 189 and 190:
Challenges When I’we been newly e
- Page 191 and 192:
Personal development Personal devel
- Page 193 and 194:
A very important part of the activi
- Page 195 and 196:
The latter since the difference bet
- Page 197 and 198:
Generally I find that the less phys
- Page 199 and 200:
It is quite common that the employe
- Page 201 and 202:
Tabell 5. What skills as a mechanic
- Page 203 and 204:
Stress Stress is a physical reactio
- Page 205 and 206:
About getting rich What’s wealth
- Page 207 and 208:
Income and expenditure Someone who
- Page 209 and 210:
Investments in securities As far as
- Page 211 and 212:
For those who avoid crisis companie
- Page 213 and 214:
Summary of the interest on mortgage
- Page 215 and 216:
Before the IT crash in 2001 everyth
- Page 217 and 218:
As hopefully seen in the earlier re
- Page 219 and 220:
It does need not be difficult to, a
- Page 221 and 222:
On the other hand, the average temp
- Page 223 and 224:
A variant to trading stocks is to t
- Page 225 and 226:
Currency trading I have no experien
- Page 227 and 228:
Retirement savings Those who discus
- Page 229 and 230:
But this model is only partially tr
- Page 231 and 232:
The state think that the forest is
- Page 233 and 234:
0,60 Average price each year SEK /k
- Page 235 and 236:
Apartment blocks You can either buy
- Page 237 and 238:
Individual homes An alternative to
- Page 239 and 240:
Regulatory requirements Just as in
- Page 241 and 242:
Deicing and snow on stairs, etc. If
- Page 243 and 244:
Water traps and floor drains in hom
- Page 245 and 246:
Table 1a. Proposed checkpoints for
- Page 247 and 248:
Table 1c. Proposed checkpoints for
- Page 249 and 250:
Bath, toilet and kitchen Unsecure e
- Page 251 and 252:
Table 1f. Proposed checkpoints for
- Page 253 and 254:
Bad water pipes It is common in old
- Page 255 and 256:
Facade damage, brick facades Brick
- Page 257 and 258:
Burglary and vandalism Researchers
- Page 259 and 260:
Contractors When an action is decid
- Page 261 and 262:
In most cases, the income is fairly
- Page 263 and 264:
Social management My experience is
- Page 265 and 266:
Increase the area that generate rev
- Page 267 and 268:
References Arbetsmiljöverket (2005
- Page 269 and 270:
Here are some suggestions: Ergonomi
- Page 271 and 272:
Although physical deficiencies in t
- Page 273 and 274:
Service production has in some case
- Page 275 and 276:
In general, work environment polici
- Page 277 and 278:
Languages A quick lesson in languag
- Page 279 and 280:
Nouns continued English Swedish Fre
- Page 281 and 282:
Weekdays and months English Swedish
- Page 283 and 284:
Figures English Swedish French 2 Sp
- Page 285 and 286:
Miscellaneous continued. English Sw
- Page 287 and 288:
Capital letters and paragraphs Sent
- Page 289 and 290:
How nouns are All words that descri
- Page 291 and 292:
Short vowels are not always followe
- Page 293 and 294:
Sometimes it is not en but ett Abou
- Page 295 and 296:
Var means the same as är but in th
- Page 297 and 298:
Then for some reason you use mer (m
- Page 299 and 300:
Twenty should be called tvåtio Num
- Page 301 and 302:
A quick lesson in writing Probably
- Page 303 and 304:
Damn, I have to hide myself, it's t
- Page 305 and 306:
- I will probably go home now, I mu
- Page 307 and 308:
Anyone who has ambition to make a g
- Page 309 and 310:
It may be easier to find something
- Page 311 and 312:
However, it is not necessarily to a
- Page 313 and 314:
2. In the eye’s of the described
- Page 315 and 316:
It is obviously important that peop
- Page 317 and 318:
The events should, as well as the t
- Page 319 and 320:
From the outside Objectively Anyone
- Page 321 and 322:
It could certainly be done in a muc
- Page 323 and 324:
The confusion regarding who says wh
- Page 325 and 326:
Introductions Some think that the f
- Page 327 and 328:
Checklist - Do not poke and modify
- Page 329 and 330:
About proverbs Proverbs are complet
- Page 331 and 332:
Quite a number of proverbs in the A
- Page 333 and 334:
There are many more proverbs in the
- Page 335 and 336:
Many children books and comics are
- Page 337 and 338:
Animals maybe not knew how to use a
- Page 339 and 340:
How can a dog talk to a bird But if
- Page 341 and 342:
Have you read any fairtails There c
- Page 343 and 344:
The history of amusements 343
- Page 345 and 346:
Visual arts Paintings After visitin
- Page 347 and 348:
Abstract It is difficult to see tha
- Page 349 and 350:
Photo art Most cases in which someo
- Page 351 and 352:
In addition, musicians was given a
- Page 353 and 354:
In the 1960s, however, created the
- Page 355 and 356:
Radio and moving pictures Radio 192
- Page 357 and 358:
TV 1920-50's television technology
- Page 359 and 360:
Performing arts Circus Circus is cr
- Page 361 and 362:
Musical The musical is said to be d
- Page 363 and 364:
La donna del lago 1819 10 Gioachino
- Page 365 and 366:
Theater Probably the church dominat
- Page 367 and 368:
Sports People probably has competed
- Page 369 and 370:
Football. They have found evidence
- Page 371 and 372:
Games Playing cards may have been u
- Page 373 and 374:
Journals The world's first daily ne
- Page 375 and 376:
Probably everyone appreciates a rep
- Page 377 and 378:
One reason could be that the art ph
- Page 379 and 380:
73% of the photographic works at th
- Page 381 and 382:
Jus as regarding photography, every
- Page 383 and 384:
One explanation for the differences
- Page 385 and 386:
The purpose of sports consumption W
- Page 387 and 388:
Table 2. Selection of Sweden/Swedes
- Page 389 and 390:
Table 3. Roughly the number of page
- Page 391 and 392:
The purpose of pets From a human pe
- Page 393 and 394:
Table 3. The participants' percepti