program plan - Entergy New Orleans, Inc.
program plan - Entergy New Orleans, Inc.
program plan - Entergy New Orleans, Inc.

You also want an ePaper? Increase the reach of your titles
YUMPU automatically turns print PDFs into web optimized ePapers that Google loves.
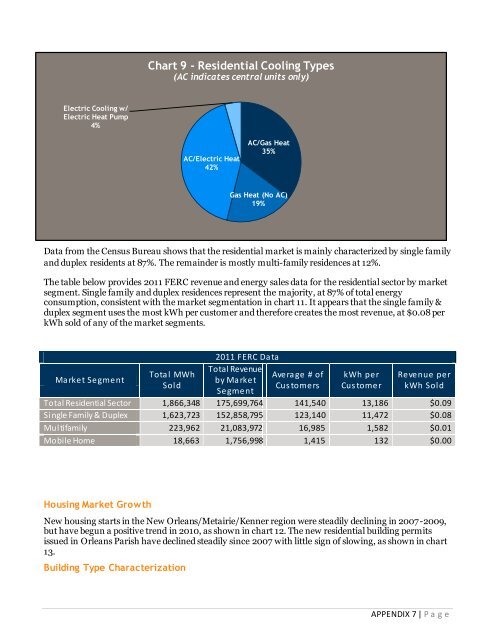
Chart 9 - Residential Cooling Types<br />
(AC indicates central units only)<br />
Electric Cooling w/<br />
Electric Heat Pump<br />
4%<br />
AC/Electric Heat<br />
42%<br />
AC/Gas Heat<br />
35%<br />
Gas Heat (No AC)<br />
19%<br />
Data from the Census Bureau shows that the residential market is mainly characterized by single family<br />
and duplex residents at 87%. The remainder is mostly multi-family residences at 12%.<br />
The table below provides 2011 FERC revenue and energy sales data for the residential sector by market<br />
segment. Single family and duplex residences represent the majority, at 87% of total energy<br />
consumption, consistent with the market segmentation in chart 11. It appears that the single family &<br />
duplex segment uses the most kWh per customer and therefore creates the most revenue, at $0.08 per<br />
kWh sold of any of the market segments.<br />
Ma rket Segment<br />
Tota l MWh<br />
Sold<br />
2011 FERC Da ta<br />
Total Revenue<br />
Avera ge # of<br />
by Ma rket<br />
Cus tomers<br />
Segment<br />
kWh per<br />
Cus tomer<br />
Revenue per<br />
kWh Sold<br />
Total Residential Sector 1,866,348 175,699,764 141,540 13,186 $0.09<br />
Single Family & Duplex 1,623,723 152,858,795 123,140 11,472 $0.08<br />
Multifamily 223,962 21,083,972 16,985 1,582 $0.01<br />
Mobile Home 18,663 1,756,998 1,415 132 $0.00<br />
Housing Market Growth<br />
<strong>New</strong> housing starts in the <strong>New</strong> <strong>Orleans</strong>/Metairie/Kenner region were steadily declining in 2007-2009,<br />
but have begun a positive trend in 2010, as shown in chart 12. The new residential building permits<br />
issued in <strong>Orleans</strong> Parish have declined steadily since 2007 with little sign of slowing, as shown in chart<br />
13.<br />
Building Type Characterization<br />
APPENDIX 7 | P a g e