Teaching Algebra with Manipulatives
Teaching Algebra with Manipulatives
Teaching Algebra with Manipulatives

Create successful ePaper yourself
Turn your PDF publications into a flip-book with our unique Google optimized e-Paper software.
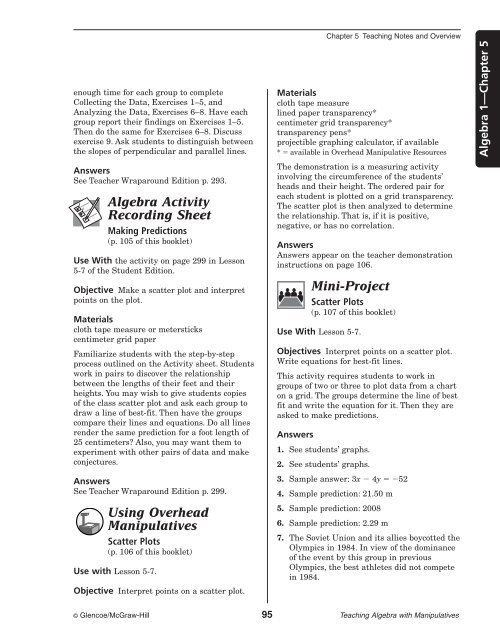
Chapter 5 <strong>Teaching</strong> Notes and Overview<br />
enough time for each group to complete<br />
Collecting the Data, Exercises 1–5, and<br />
Analyzing the Data, Exercises 6–8. Have each<br />
group report their findings on Exercises 1–5.<br />
Then do the same for Exercises 6–8. Discuss<br />
exercise 9. Ask students to distinguish between<br />
the slopes of perpendicular and parallel lines.<br />
Answers<br />
See Teacher Wraparound Edition p. 293.<br />
<strong>Algebra</strong> Activity<br />
Recording Sheet<br />
Making Predictions<br />
(p. 105 of this booklet)<br />
Use With the activity on page 299 in Lesson<br />
5-7 of the Student Edition.<br />
Objective Make a scatter plot and interpret<br />
points on the plot.<br />
Materials<br />
cloth tape measure or metersticks<br />
centimeter grid paper<br />
Familiarize students <strong>with</strong> the step-by-step<br />
process outlined on the Activity sheet. Students<br />
work in pairs to discover the relationship<br />
between the lengths of their feet and their<br />
heights. You may wish to give students copies<br />
of the class scatter plot and ask each group to<br />
draw a line of best-fit. Then have the groups<br />
compare their lines and equations. Do all lines<br />
render the same prediction for a foot length of<br />
25 centimeters? Also, you may want them to<br />
experiment <strong>with</strong> other pairs of data and make<br />
conjectures.<br />
Answers<br />
See Teacher Wraparound Edition p. 299.<br />
Using Overhead<br />
<strong>Manipulatives</strong><br />
Scatter Plots<br />
(p. 106 of this booklet)<br />
Use <strong>with</strong> Lesson 5-7.<br />
Objective Interpret points on a scatter plot.<br />
Materials<br />
cloth tape measure<br />
lined paper transparency*<br />
centimeter grid transparency*<br />
transparency pens*<br />
projectible graphing calculator, if available<br />
* available in Overhead Manipulative Resources<br />
The demonstration is a measuring activity<br />
involving the circumference of the students’<br />
heads and their height. The ordered pair for<br />
each student is plotted on a grid transparency.<br />
The scatter plot is then analyzed to determine<br />
the relationship. That is, if it is positive,<br />
negative, or has no correlation.<br />
Answers<br />
Answers appear on the teacher demonstration<br />
instructions on page 106.<br />
Mini-Project<br />
Scatter Plots<br />
(p. 107 of this booklet)<br />
Use With Lesson 5-7.<br />
Objectives Interpret points on a scatter plot.<br />
Write equations for best-fit lines.<br />
This activity requires students to work in<br />
groups of two or three to plot data from a chart<br />
on a grid. The groups determine the line of best<br />
fit and write the equation for it. Then they are<br />
asked to make predictions.<br />
Answers<br />
1. See students’ graphs.<br />
2. See students’ graphs.<br />
3. Sample answer: 3x 4y 52<br />
4. Sample prediction: 21.50 m<br />
5. Sample prediction: 2008<br />
6. Sample prediction: 2.29 m<br />
7. The Soviet Union and its allies boycotted the<br />
Olympics in 1984. In view of the dominance<br />
of the event by this group in previous<br />
Olympics, the best athletes did not compete<br />
in 1984.<br />
<strong>Algebra</strong> 1—Chapter 5<br />
© Glencoe/McGraw-Hill 95 <strong>Teaching</strong> <strong>Algebra</strong> <strong>with</strong> <strong>Manipulatives</strong>