- Page 1 and 2:
38˚ 36˚ 34˚ 32˚ 38˚ 36˚ 34˚
- Page 3 and 4:
Table of Contents Table of Contents
- Page 5 and 6:
SCEC Annual Meeting Program Sunday,
- Page 7 and 8:
15:15 Introduction to the Automatic
- Page 9 and 10:
Monday, September 12th 07:00 - 08:0
- Page 11 and 12:
MONDAY | Meeting Program observatio
- Page 13 and 14:
TUESDAY | Meeting Program evolution
- Page 15 and 16:
TUESDAY | Meeting Program 17:20 Dra
- Page 17 and 18:
WEDNESDAY | Meeting Program seismic
- Page 19 and 20:
SCEC DIrector | Report reviews, bot
- Page 21 and 22: SCEC DIrector | Report The current
- Page 23 and 24: SCEC DIrector | Report meetings to
- Page 25 and 26: A Word of Thanks Figure 4. This "Br
- Page 27 and 28: SCEC Advisory Council | Report Afte
- Page 29 and 30: SCEC Advisory Council | Report and
- Page 31 and 32: SCEC Advisory Council | Report 3. C
- Page 33 and 34: Input and reaction to the SCEC4 Pro
- Page 35 and 36: SCEC Advisory Council | Report meet
- Page 37 and 38: Communication, Education, and Outre
- Page 39 and 40: Communication, Education, and Outre
- Page 41 and 42: Communication, Education, and Outre
- Page 43 and 44: Communication, Education, and Outre
- Page 45 and 46: SCEC Research Accomplishments | Rep
- Page 47 and 48: Lett., Seismological Society of Ame
- Page 49 and 50: Funning et al. resurveyed 19 GPS si
- Page 51 and 52: earthquakes. They find that plastic
- Page 53 and 54: Earthquake Geology SCEC Research Ac
- Page 55 and 56: SCEC researchers are also attemptin
- Page 57 and 58: observed waveforms (after Olsen and
- Page 59 and 60: SCEC Research Accomplishments | Rep
- Page 61 and 62: urial depth, long-term tectonic str
- Page 63 and 64: SCEC Research Accomplishments | Rep
- Page 65 and 66: SCEC Research Accomplishments | Rep
- Page 67 and 68: Figure 31. Image of the branching j
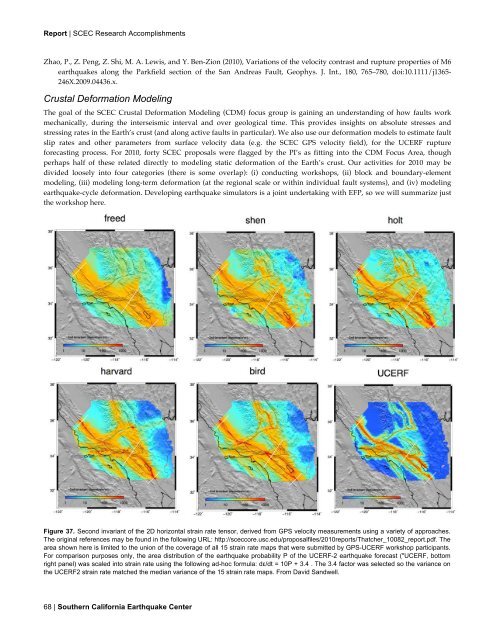
- Page 69 and 70: SCEC Research Accomplishments | Rep
- Page 71: SCEC Research Accomplishments | Rep
- Page 75 and 76: SCEC Research Accomplishments | Rep
- Page 77 and 78: Local-Scale Models CDM group resear
- Page 79 and 80: SCEC Research Accomplishments | Rep
- Page 81 and 82: Figure 54. CLM splitting from mantl
- Page 83 and 84: Figure 59. The short-term rates aft
- Page 85 and 86: SCEC Research Accomplishments | Rep
- Page 87 and 88: esponse peaks to the incident groun
- Page 89 and 90: SCEC Research Accomplishments | Rep
- Page 91 and 92: Non-Linear Structural Simulations u
- Page 93 and 94: SCEC Research Accomplishments | Rep
- Page 95 and 96: SCEC Research Accomplishments | Rep
- Page 97 and 98: SCEC Research Accomplishments | Rep
- Page 99 and 100: References SCEC Research Accomplish
- Page 101 and 102: SCEC Research Accomplishments | Rep
- Page 103 and 104: SCEC Research Accomplishments | Rep
- Page 105 and 106: Draft 2012 Science Plan SCEC Planni
- Page 107 and 108: Draft 2012 Science Plan H. Award Pr
- Page 109 and 110: B. Proposals may be strengthened by
- Page 111 and 112: Draft 2012 Science Plan 2a. Improve
- Page 113 and 114: A. Seismology Draft 2012 Science Pl
- Page 115 and 116: Draft 2012 Science Plan • Quantif
- Page 117 and 118: IX. Interdisciplinary Focus Areas D
- Page 119 and 120: Draft 2012 Science Plan E. Developm
- Page 121 and 122: Draft 2012 Science Plan objectives
- Page 123 and 124:
Draft 2012 Science Plan relax segme
- Page 125 and 126:
D. National Partnerships through Ea
- Page 127 and 128:
A-024 VISUALIZING STRUCTURAL RESPON
- Page 129 and 130:
A-137 DISCOVERING THE GEOMORPHIC RE
- Page 131 and 132:
A-103 IMPACTS OF STATIC AND DYNAMIC
- Page 133 and 134:
A-072 ANALYZING BUILDING RESPONSE T
- Page 135 and 136:
B-147 INCORPORATING GPS VELOCITIES
- Page 137 and 138:
INHIBITION OF VERY STRONG SHAKING,
- Page 139 and 140:
B-030 EARTHQUAKE CLUSTERING AND AFT
- Page 141 and 142:
B-127 SEISMOGRAM-BASED ASSESSMENT O
- Page 143 and 144:
Poster Abstracts New paleoseismolog
- Page 145 and 146:
Poster Abstracts ground motion depe
- Page 147 and 148:
Poster Abstracts this delay becomes
- Page 149 and 150:
Poster Abstracts time series analys
- Page 151 and 152:
Poster Abstracts of a ‘weight vec
- Page 153 and 154:
Perris2: .17, .16, .20, .23 Poster
- Page 155 and 156:
Poster Abstracts amplitude with the
- Page 157 and 158:
Poster Abstracts COMPARISON OF CO-L
- Page 159 and 160:
Poster Abstracts found at other sta
- Page 161 and 162:
Poster Abstracts This poster will p
- Page 163 and 164:
Poster Abstracts Previous models of
- Page 165 and 166:
Poster Abstracts of surface deforma
- Page 167 and 168:
ADDITIONAL SHEAR RESISTANCE FROM FA
- Page 169 and 170:
Poster Abstracts Seismic data were
- Page 171 and 172:
Poster Abstracts providing omega-sq
- Page 173 and 174:
Poster Abstracts understanding the
- Page 175 and 176:
Poster Abstracts Although substanti
- Page 177 and 178:
Poster Abstracts We will present th
- Page 179 and 180:
E.H. Hearn, F.F. Pollitz, W.R. That
- Page 181 and 182:
S. Hiemer, Q. Wang, D.D. Jackson, Y
- Page 183 and 184:
Poster Abstracts STRONG GROUND MOTI
- Page 185 and 186:
Poster Abstracts incorporated as ad
- Page 187 and 188:
Poster Abstracts velocity model in
- Page 189 and 190:
Poster Abstracts InSAR results base
- Page 191 and 192:
Poster Abstracts We have observed h
- Page 193 and 194:
Poster Abstracts near the rupture f
- Page 195 and 196:
Poster Abstracts CRUSTAL STRUCTURE
- Page 197 and 198:
Poster Abstracts volume from the RG
- Page 199 and 200:
Poster Abstracts individuals (30%),
- Page 201 and 202:
Poster Abstracts and Northridge Hil
- Page 203 and 204:
Poster Abstracts In an emergent vie
- Page 205 and 206:
Poster Abstracts analysis into a ge
- Page 207 and 208:
Poster Abstracts silts and sands. T
- Page 209 and 210:
Poster Abstracts Pegasus WMS provid
- Page 211 and 212:
Poster Abstracts THE 2011 MW 9 TOHO
- Page 213 and 214:
Poster Abstracts has proved to be a
- Page 215 and 216:
Poster Abstracts Preliminary result
- Page 217 and 218:
Poster Abstracts Comparison of this
- Page 219 and 220:
Poster Abstracts DYNAMIC RUPTURE SI
- Page 221 and 222:
Poster Abstracts between our two me
- Page 223 and 224:
Poster Abstracts 3.0 sec). In the w
- Page 225 and 226:
Poster Abstracts distance from past
- Page 227 and 228:
Poster Abstracts colonies would be
- Page 229 and 230:
Poster Abstracts SPACE GEODETIC INV
- Page 231 and 232:
Poster Abstracts and 1857. Individu
- Page 233 and 234:
ADVANCEMENTS IN PROBABILISTIC SEISM
- Page 235 and 236:
CONSTANT STRESS DROP FITS EARTHQUAK
- Page 237 and 238:
Poster Abstracts 233 e 233 a 233 r
- Page 239 and 240:
Poster Abstracts mainshock, but the
- Page 241 and 242:
Poster Abstracts PLATE TECTONICS: A
- Page 243 and 244:
Poster Abstracts THE MECHANICS OF E
- Page 245 and 246:
Poster Abstracts 241 C 241 a 241 l
- Page 247 and 248:
Poster Abstracts Geodetic and geolo
- Page 249 and 250:
COMPARISONS AMONG EARTHQUAKE SIMULA
- Page 251 and 252:
Poster Abstracts compaction of a di
- Page 253 and 254:
Poster Abstracts installed and tele
- Page 255 and 256:
Poster Abstracts are adopted for up
- Page 257 and 258:
Poster Abstracts safety zones for t
- Page 259 and 260:
Z. Xu and P. Chen Poster Abstracts
- Page 261 and 262:
Poster Abstracts The Whittier fault
- Page 263 and 264:
Poster Abstracts SAF have had a maj
- Page 265 and 266:
Poster Abstracts ground motions whi
- Page 267 and 268:
FREYMUELLER Jeffrey, U Alaska Fairb
- Page 269 and 270:
RUIZ Ricardo, Chaffey HS RUNDLE Joh