Annual Meeting - SCEC.org
Annual Meeting - SCEC.org
Annual Meeting - SCEC.org

Create successful ePaper yourself
Turn your PDF publications into a flip-book with our unique Google optimized e-Paper software.
Report | <strong>SCEC</strong> Research Accomplishments<br />
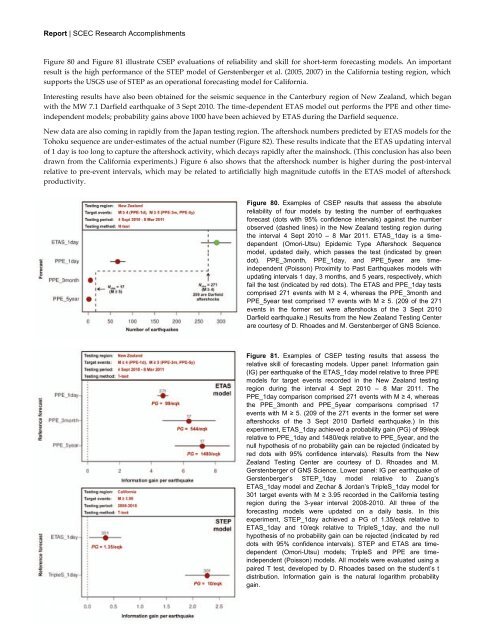
Figure 80 and Figure 81 illustrate CSEP evaluations of reliability and skill for short-term forecasting models. An important<br />
result is the high performance of the STEP model of Gerstenberger et al. (2005, 2007) in the California testing region, which<br />
supports the USGS use of STEP as an operational forecasting model for California.<br />
Interesting results have also been obtained for the seismic sequence in the Canterbury region of New Zealand, which began<br />
with the MW 7.1 Darfield earthquake of 3 Sept 2010. The time-dependent ETAS model out performs the PPE and other timeindependent<br />
models; probability gains above 1000 have been achieved by ETAS during the Darfield sequence.<br />
New data are also coming in rapidly from the Japan testing region. The aftershock numbers predicted by ETAS models for the<br />
Tohoku sequence are under-estimates of the actual number (Figure 82). These results indicate that the ETAS updating interval<br />
of 1 day is too long to capture the aftershock activity, which decays rapidly after the mainshock. (This conclusion has also been<br />
drawn from the California experiments.) Figure 6 also shows that the aftershock number is higher during the post-interval<br />
relative to pre-event intervals, which may be related to artificially high magnitude cutoffs in the ETAS model of aftershock<br />
productivity.<br />
94 | Southern California Earthquake Center<br />
Figure 80. Examples of CSEP results that assess the absolute<br />
reliability of four models by testing the number of earthquakes<br />
forecast (dots with 95% confidence intervals) against the number<br />
observed (dashed lines) in the New Zealand testing region during<br />
the interval 4 Sept 2010 – 8 Mar 2011. ETAS_1day is a timedependent<br />
(Omori-Utsu) Epidemic Type Aftershock Sequence<br />
model, updated daily, which passes the test (indicated by green<br />
dot). PPE_3month, PPE_1day, and PPE_5year are timeindependent<br />
(Poisson) Proximity to Past Earthquakes models with<br />
updating intervals 1 day, 3 months, and 5 years, respectively, which<br />
fail the test (indicated by red dots). The ETAS and PPE_1day tests<br />
comprised 271 events with M ≥ 4, whereas the PPE_3month and<br />
PPE_5year test comprised 17 events with M ≥ 5. (209 of the 271<br />
events in the former set were aftershocks of the 3 Sept 2010<br />
Darfield earthquake.) Results from the New Zealand Testing Center<br />
are courtesy of D. Rhoades and M. Gerstenberger of GNS Science.<br />
Figure 81. Examples of CSEP testing results that assess the<br />
relative skill of forecasting models. Upper panel: Information gain<br />
(IG) per earthquake of the ETAS_1day model relative to three PPE<br />
models for target events recorded in the New Zealand testing<br />
region during the interval 4 Sept 2010 – 8 Mar 2011. The<br />
PPE_1day comparison comprised 271 events with M ≥ 4, whereas<br />
the PPE_3month and PPE_5year comparisons comprised 17<br />
events with M ≥ 5. (209 of the 271 events in the former set were<br />
aftershocks of the 3 Sept 2010 Darfield earthquake.) In this<br />
experiment, ETAS_1day achieved a probability gain (PG) of 99/eqk<br />
relative to PPE_1day and 1480/eqk relative to PPE_5year, and the<br />
null hypothesis of no probability gain can be rejected (indicated by<br />
red dots with 95% confidence intervals). Results from the New<br />
Zealand Testing Center are courtesy of D. Rhoades and M.<br />
Gerstenberger of GNS Science. Lower panel: IG per earthquake of<br />
Gerstenberger’s STEP_1day model relative to Zuang’s<br />
ETAS_1day model and Zechar & Jordan’s TripleS_1day model for<br />
301 target events with M ≥ 3.95 recorded in the California testing<br />
region during the 3-year interval 2008-2010. All three of the<br />
forecasting models were updated on a daily basis. In this<br />
experiment, STEP_1day achieved a PG of 1.35/eqk relative to<br />
ETAS_1day and 10/eqk relative to TripleS_1day, and the null<br />
hypothesis of no probability gain can be rejected (indicated by red<br />
dots with 95% confidence intervals). STEP and ETAS are timedependent<br />
(Omori-Utsu) models; TripleS and PPE are timeindependent<br />
(Poisson) models. All models were evaluated using a<br />
paired T test, developed by D. Rhoades based on the student’s t<br />
distribution. Information gain is the natural logarithm probability<br />
gain.