Annual Meeting - SCEC.org
Annual Meeting - SCEC.org
Annual Meeting - SCEC.org

Create successful ePaper yourself
Turn your PDF publications into a flip-book with our unique Google optimized e-Paper software.
Report | <strong>SCEC</strong> Research Accomplishments<br />
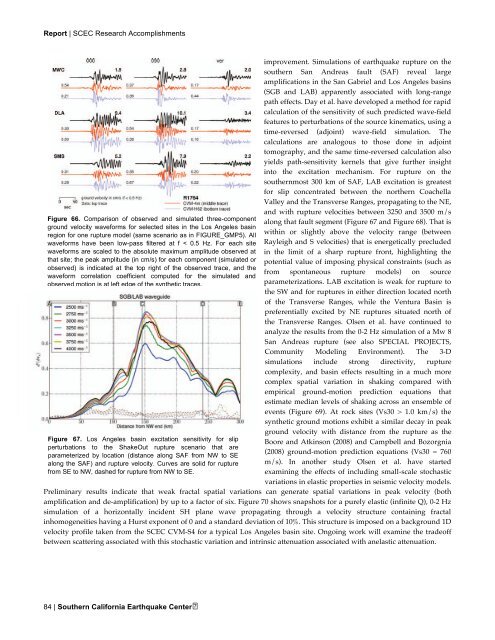
Figure 66. Comparison of observed and simulated three-component<br />
ground velocity waveforms for selected sites in the Los Angeles basin<br />
region for one rupture model (same scenario as in FIGURE_GMP5). All<br />
waveforms have been low-pass filtered at f < 0.5 Hz. For each site<br />
waveforms are scaled to the absolute maximum amplitude observed at<br />
that site; the peak amplitude (in cm/s) for each component (simulated or<br />
observed) is indicated at the top right of the observed trace, and the<br />
waveform correlation coefficient computed for the simulated and<br />
observed motion is at left edge of the synthetic traces.<br />
Figure 67. Los Angeles basin excitation sensitivity for slip<br />
perturbations to the ShakeOut rupture scenario that are<br />
parameterized by location (distance along SAF from NW to SE<br />
along the SAF) and rupture velocity. Curves are solid for rupture<br />
from SE to NW, dashed for rupture from NW to SE.<br />
84 | Southern California Earthquake Center<br />
improvement. Simulations of earthquake rupture on the<br />
southern San Andreas fault (SAF) reveal large<br />
amplifications in the San Gabriel and Los Angeles basins<br />
(SGB and LAB) apparently associated with long-range<br />
path effects. Day et al. have developed a method for rapid<br />
calculation of the sensitivity of such predicted wave-field<br />
features to perturbations of the source kinematics, using a<br />
time-reversed (adjoint) wave-field simulation. The<br />
calculations are analogous to those done in adjoint<br />
tomography, and the same time-reversed calculation also<br />
yields path-sensitivity kernels that give further insight<br />
into the excitation mechanism. For rupture on the<br />
southernmost 300 km of SAF, LAB excitation is greatest<br />
for slip concentrated between the northern Coachella<br />
Valley and the Transverse Ranges, propagating to the NE,<br />
and with rupture velocities between 3250 and 3500 m/s<br />
along that fault segment (Figure 67 and Figure 68). That is<br />
within or slightly above the velocity range (between<br />
Rayleigh and S velocities) that is energetically precluded<br />
in the limit of a sharp rupture front, highlighting the<br />
potential value of imposing physical constraints (such as<br />
from spontaneous rupture models) on source<br />
parameterizations. LAB excitation is weak for rupture to<br />
the SW and for ruptures in either direction located north<br />
of the Transverse Ranges, while the Ventura Basin is<br />
preferentially excited by NE ruptures situated north of<br />
the Transverse Ranges. Olsen et al. have continued to<br />
analyze the results from the 0-2 Hz simulation of a Mw 8<br />
San Andreas rupture (see also SPECIAL PROJECTS,<br />
Community Modeling Environment). The 3-D<br />
simulations include strong directivity, rupture<br />
complexity, and basin effects resulting in a much more<br />
complex spatial variation in shaking compared with<br />
empirical ground-motion prediction equations that<br />
estimate median levels of shaking across an ensemble of<br />
events (Figure 69). At rock sites (Vs30 > 1.0 km/s) the<br />
synthetic ground motions exhibit a similar decay in peak<br />
ground velocity with distance from the rupture as the<br />
Boore and Atkinson (2008) and Campbell and Boz<strong>org</strong>nia<br />
(2008) ground-motion prediction equations (Vs30 = 760<br />
m/s). In another study Olsen et al. have started<br />
examining the effects of including small-scale stochastic<br />
variations in elastic properties in seismic velocity models.<br />
Preliminary results indicate that weak fractal spatial variations can generate spatial variations in peak velocity (both<br />
amplification and de-amplification) by up to a factor of six. Figure 70 shows snapshots for a purely elastic (infinite Q), 0-2 Hz<br />
simulation of a horizontally incident SH plane wave propagating through a velocity structure containing fractal<br />
inhomogeneities having a Hurst exponent of 0 and a standard deviation of 10%. This structure is imposed on a background 1D<br />
velocity profile taken from the <strong>SCEC</strong> CVM-S4 for a typical Los Angeles basin site. Ongoing work will examine the tradeoff<br />
between scattering associated with this stochastic variation and intrinsic attenuation associated with anelastic attenuation.