Annual Meeting - SCEC.org
Annual Meeting - SCEC.org
Annual Meeting - SCEC.org

You also want an ePaper? Increase the reach of your titles
YUMPU automatically turns print PDFs into web optimized ePapers that Google loves.
Non-Linear Structural Simulations using <strong>SCEC</strong> Simulated Ground Motions<br />
Although substantial progress has been made in physicsbased<br />
ground motion simulations in the recent years, the<br />
engineering community is still reluctant to use simulated<br />
time series for design. One of the reasons for this is a lack<br />
of understanding of how simulated ground motions<br />
compare to recorded ground motions, especially when it<br />
comes to their impact on structural response. There are ongoing<br />
efforts at validation and verification of simulated<br />
ground motions, but these tend to be focused on record<br />
properties or on the response of single-degree-of-freedom<br />
systems. Goulet, Haselton and Bayless (2011) used a<br />
different approach by comparing the nonlinear structural<br />
response of buildings subjected to recorded and simulated<br />
ground motions, given that both sets had similar response<br />
spectral shapes.<br />
<strong>SCEC</strong> Research Accomplishments | Report<br />
The responses of buildings to recorded motions were<br />
already been processed in a project recently completed by the PIs. The recorded set is representative of a magnitude 7<br />
earthquake, rupturing within 20 km from a site in a shallow crustal tectonic environment such as California. The <strong>SCEC</strong><br />
simulated records were selected for the same type of event and distance with spectral shapes that were consistent with the<br />
recorded set. Structural simulations were then performed for three computer-modeled concrete structures, and the response<br />
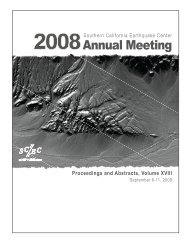
results from both sets of time series were compared. Figure 71 shows a summary of the maximum inter-story drift ratio<br />
(MIDR) results obtained from the structural simulations. The vertical data stripes correspond to the MIDR results for all three<br />
buildings, for both the recorded and simulated time series. For each stripe, the maximum and minimum values were removed.<br />
For all three buildings, the ranges of MIDR values are similar, but the overall distribution of values for the recorded and<br />
simulated sets tend to differ for a given building. This leads to a large difference in the median MIDR estimate for building B,<br />
but to no statistical difference for building C. The preliminary conclusion based on the two datasets used is that the simulated<br />
ground motions led to structural response that<br />
were consistent with those derived from<br />
recorded motions.<br />
Validation of End-to-End Simulation of<br />
Building Response using Ground<br />
Motion Simulations<br />
This study had the objective of validating the<br />
use of simulated ground motions by<br />
integrating physics-based ground motion<br />
simulation and performance-based damage<br />
estimates and examining, probabilistically,<br />
building response due to both simulated and<br />
recorded ground motions. The research<br />
involved the comparison of building response<br />
to two earthquake scenarios: the 7.8Mw Los<br />
Angeles region ShakeOut scenario developed<br />
by Graves et al. (2008), a repeat of the 1906 San<br />
Francisco earthquake generated by Aagaard et<br />
al. (2009), and the Puente Hills scenario<br />
developed by Graves et al. (2006).<br />
Figure 71. Summary of structural simulation results for buildings B (12<br />
stories), C (20 stories) and E (4 stories) and for both the recorded (Rec)<br />
and simulated (Sim) acceleration time series.<br />
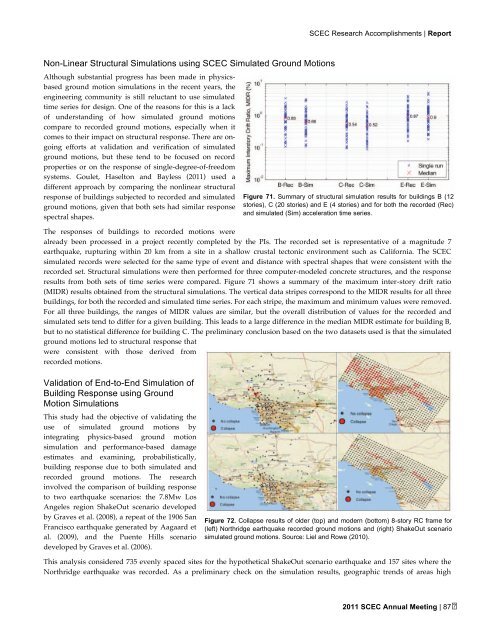
Figure 72. Collapse results of older (top) and modern (bottom) 8-story RC frame for<br />
(left) Northridge earthquake recorded ground motions and (right) ShakeOut scenario<br />
simulated ground motions. Source: Liel and Rowe (2010).<br />
This analysis considered 735 evenly spaced sites for the hypothetical ShakeOut scenario earthquake and 157 sites where the<br />
Northridge earthquake was recorded. As a preliminary check on the simulation results, geographic trends of areas high<br />
2011 <strong>SCEC</strong> <strong>Annual</strong> <strong>Meeting</strong> | 87