thèse doctorat de l'université bordeaux 2 - ISPED-Enseignement à ...
thèse doctorat de l'université bordeaux 2 - ISPED-Enseignement à ...
thèse doctorat de l'université bordeaux 2 - ISPED-Enseignement à ...

You also want an ePaper? Increase the reach of your titles
YUMPU automatically turns print PDFs into web optimized ePapers that Google loves.
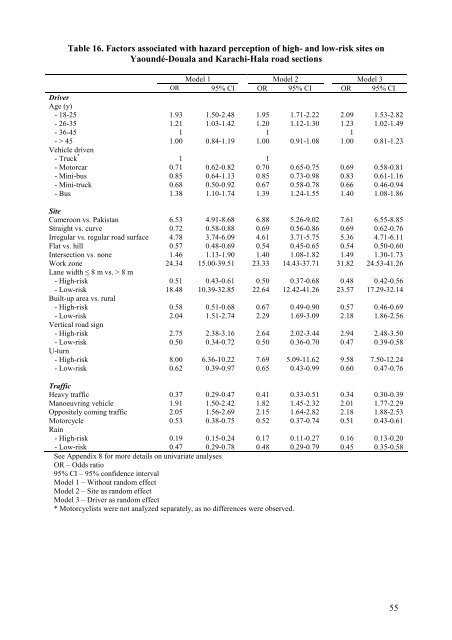
Table 16. Factors associated with hazard perception of high- and low-risk sites onYaoundé-Douala and Karachi-Hala road sectionsMo<strong>de</strong>l 1 Mo<strong>de</strong>l 2 Mo<strong>de</strong>l 3OR 95% CI OR 95% CI OR 95% CIDriverAge (y)- 18-25 1.93 1.50-2.48 1.95 1.71-2.22 2.09 1.53-2.82- 26-35 1.21 1.03-1.42 1.20 1.12-1.30 1.23 1.02-1.49- 36-45 1 1 1- > 45 1.00 0.84-1.19 1.00 0.91-1.08 1.00 0.81-1.23Vehicle driven- Truck * 1 1- Motorcar 0.71 0.62-0.82 0.70 0.65-0.75 0.69 0.58-0.81- Mini-bus 0.85 0.64-1.13 0.85 0.73-0.98 0.83 0.61-1.16- Mini-truck 0.68 0.50-0.92 0.67 0.58-0.78 0.66 0.46-0.94- Bus 1.38 1.10-1.74 1.39 1.24-1.55 1.40 1.08-1.86SiteCameroon vs. Pakistan 6.53 4.91-8.68 6.88 5.26-9.02 7.61 6.55-8.85Straight vs. curve 0.72 0.58-0.88 0.69 0.56-0.86 0.69 0.62-0.76Irregular vs. regular road surface 4.78 3.74-6.09 4.61 3.71-5.75 5.36 4.71-6.11Flat vs. hill 0.57 0.48-0.69 0.54 0.45-0.65 0.54 0.50-0.60Intersection vs. none 1.46 1.13-1.90 1.40 1.08-1.82 1.49 1.30-1.73Work zone 24.34 15.00-39.51 23.33 14.43-37.71 31.82 24.53-41.26Lane width ≤ 8 m vs. > 8 m- High-risk 0.51 0.43-0.61 0.50 0.37-0.68 0.48 0.42-0.56- Low-risk 18.48 10.39-32.85 22.64 12.42-41.26 23.57 17.29-32.14Built-up area vs. rural- High-risk 0.58 0.51-0.68 0.67 0.49-0.90 0.57 0.46-0.69- Low-risk 2.04 1.51-2.74 2.29 1.69-3.09 2.18 1.86-2.56Vertical road sign- High-risk 2.75 2.38-3.16 2.64 2.02-3.44 2.94 2.48-3.50- Low-risk 0.50 0.34-0.72 0.50 0.36-0.70 0.47 0.39-0.58U-turn- High-risk 8.00 6.36-10.22 7.69 5.09-11.62 9.58 7.50-12.24- Low-risk 0.62 0.39-0.97 0.65 0.43-0.99 0.60 0.47-0.76TrafficHeavy traffic 0.37 0.29-0.47 0.41 0.33-0.51 0.34 0.30-0.39Manoeuvring vehicle 1.91 1.50-2.42 1.82 1.45-2.32 2.01 1.77-2.29Oppositely coming traffic 2.05 1.56-2.69 2.15 1.64-2.82 2.18 1.88-2.53Motorcycle 0.53 0.38-0.75 0.52 0.37-0.74 0.51 0.43-0.61Rain- High-risk 0.19 0.15-0.24 0.17 0.11-0.27 0.16 0.13-0.20- Low-risk 0.47 0.29-0.78 0.48 0.29-0.79 0.45 0.35-0.58See Appendix 8 for more <strong>de</strong>tails on univariate analysesOR – Odds ratio95% CI – 95% confi<strong>de</strong>nce intervalMo<strong>de</strong>l 1 – Without random effectMo<strong>de</strong>l 2 – Site as random effectMo<strong>de</strong>l 3 – Driver as random effect* Motorcyclists were not analyzed separately, as no differences were observed.55