- Page 1 and 2:
The Islamic University- GazaDeanery
- Page 4 and 5:
ACKNOWLEDGMENTIn the Name of Allah,
- Page 6 and 7:
Evaluating the Inservice Training P
- Page 8 and 9:
2.2.3 Systematic and Intentional Pr
- Page 10 and 11:
5.8 Final Conclusions 1765.9 Recomm
- Page 12 and 13:
List of Figures Used in the StudyNo
- Page 14 and 15:
Chapter IStudy Statement and Backgr
- Page 16 and 17:
The Quranic celebration of knowledg
- Page 18 and 19:
that, “Continuous high quality pr
- Page 20 and 21:
study attempts to explore the reali
- Page 22 and 23:
2. It presents a set of comprehensi
- Page 24 and 25:
EvaluationEvaluation can be defined
- Page 26 and 27:
Chapter IIReview of Related Literat
- Page 28 and 29:
Chapter IILiterature ReviewIntroduc
- Page 30 and 31:
the umbrella of this trend (Abed Ha
- Page 32 and 33:
2009; Fraser et al., 2007, Remeirs
- Page 34 and 35:
3. The rapid technological, economi
- Page 36 and 37:
1. Informing teachers about changes
- Page 38 and 39:
2. Changes in students‟ learning
- Page 40 and 41:
(good) condition of a people as lon
- Page 42 and 43:
In brief, the success of INSET prog
- Page 44 and 45:
1. Training with the traditional no
- Page 46 and 47:
2.6.2 Innovative modelsThe innovati
- Page 48 and 49:
2. Some participants in the group m
- Page 50 and 51:
According to Lakshami (2009, p.14)
- Page 52 and 53:
These six major components of the I
- Page 54 and 55:
To conclude, overcoming all previou
- Page 56 and 57:
2. Participant learning, which meas
- Page 58 and 59:
Table (2.1)Guskey’s Evaluative Mo
- Page 60:
2.8 Contemporary Principles of High
- Page 63 and 64:
• Planning INSET content in the l
- Page 65:
1. Survey questionnaires.2. Open-en
- Page 68 and 69:
Section IIAn Overview of Related Pr
- Page 70 and 71:
In addition, the studies purposes,
- Page 72 and 73:
constraints, and lack of practical
- Page 74 and 75:
importantly conducting more detaile
- Page 76 and 77:
showed positive participants satisf
- Page 78 and 79:
A further relevant study was perfor
- Page 80 and 81:
school principals and teachers is n
- Page 82 and 83:
teachers' attitudes, beliefs and pr
- Page 84 and 85:
lack of openness to change, lack of
- Page 86 and 87:
Following the same track of evaluat
- Page 88 and 89:
levels of achievements. Thus, a rec
- Page 90 and 91:
Under the same umbrella, Podhajski
- Page 92 and 93:
101 students in the control group.
- Page 94 and 95:
utilizing collaboration, taking adv
- Page 96 and 97: IntroductionChapter IIIMethodology3
- Page 98 and 99: Table: (3.1)Distribution According
- Page 100 and 101: eferred to either as trends, standa
- Page 102 and 103: 3. Researchers ListsThis category i
- Page 104 and 105: 2. Most of the surveyed countries h
- Page 106 and 107: 5. The third draft was distributed
- Page 108 and 109: Table (3.5)The Final Construction o
- Page 110 and 111: 14 0.63915 0.80715 0.52717 0.51518
- Page 112 and 113: of this domain are significant at
- Page 114 and 115: Table (3.13)Cronbach's Alpha Correl
- Page 116 and 117: 3. Information can be obtained more
- Page 118 and 119: 5. Getting the permission from UNRW
- Page 120 and 121: Chapter IVThe Study FindingsIntrodu
- Page 122 and 123: established in December 1964 as a j
- Page 124 and 125: 2. Training TechniquesThe main trai
- Page 126 and 127: 2. To provide English teachers with
- Page 128 and 129: 4.2 The Answer of the Second Questi
- Page 130 and 131: 4. Training Programme Content (62.1
- Page 132 and 133: (applicable - can be applied in cla
- Page 134 and 135: The previous Table (4.5) clarifies
- Page 136 and 137: Table (4. 7) also shows that:• Th
- Page 138 and 139: 10 (are applied systematically (at
- Page 140 and 141: In addition, Table (4.11) shows tha
- Page 142 and 143: In addition, Table (4.13) shows tha
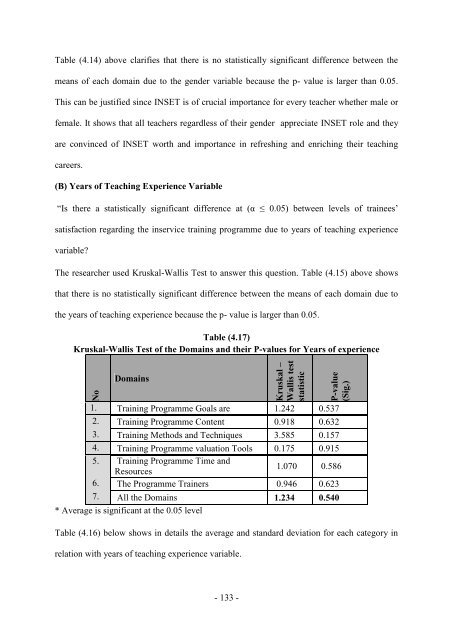
- Page 144 and 145: Table (4.20) below shows the freque
- Page 148 and 149: DomainKruskal -Wallis teststatistic
- Page 150 and 151: Table (4.21)Frequencies and the per
- Page 152 and 153: 8. Traditional but good and needed
- Page 154 and 155: 4.5.5 Question (5): “What comment
- Page 156 and 157: 4.6 The Answer of the Sixth Questio
- Page 158 and 159: Chapter VDiscussion, Conclusions, a
- Page 160 and 161: Acknowledging such limitations, EDC
- Page 162 and 163: proved in the questionnaire results
- Page 164 and 165: (68.26%) and item number 9 (develop
- Page 166 and 167: • Lack of overall policies and co
- Page 168 and 169: 4. Lack of practicality, in the sen
- Page 170 and 171: 4. Inadequate follow up of the prog
- Page 172 and 173: than the other districts. This resu
- Page 174 and 175: give us more stimulation and it wil
- Page 176 and 177: 5.6.2 DifferencesIn contrast to the
- Page 178 and 179: training facilities. The Suggested
- Page 180 and 181: particular issues as proved within
- Page 182 and 183: 6. Trainers’ selectionRashed (200
- Page 184 and 185: • Recent: using recent tools as p
- Page 186 and 187: Figure (5.1): the Suggested Evaluat
- Page 188 and 189: The Future Suggested INSETProgramme
- Page 190 and 191: 9. Lack of focus on the linguistic
- Page 192 and 193: 3. Establishing planning and evalua
- Page 194 and 195: Recommendations for Educationalists
- Page 196 and 197:
ReferencesThe Holy Qur‟an.Abdal-H
- Page 198 and 199:
Boyle, B., Lamprianou, I., & Trudy,
- Page 200 and 201:
Darling-Hammond, L.,Wei,R., Andree,
- Page 202 and 203:
Guskey. ( 1997) Research Needs to L
- Page 204 and 205:
Ji -Kim, S. (2008). An Examination
- Page 206 and 207:
Marek, E. A., & Methven, S. B. (199
- Page 208 and 209:
Porter, A., Garet,M., Desimore L, B
- Page 210 and 211:
Strucchelli, A. (2009). Inquiry in
- Page 212 and 213:
Appendices199
- Page 214 and 215:
Appendix (2) Studies ListNO The Stu
- Page 216 and 217:
NO ThecountryAppendix (4) Countries
- Page 218 and 219:
Appendix (5) The Final List of the
- Page 220 and 221:
Appendix (6) the First Draft of the
- Page 222 and 223:
Appendix(7) The second Draft of the
- Page 224 and 225:
Training Programme Evaluation Tools
- Page 226 and 227:
Appendix (8) The Third Draft of the
- Page 228 and 229:
Peer ObservationIn its simplest mea
- Page 230 and 231:
Appendix (9) The Final Questionnair
- Page 232 and 233:
Peer ObservationIn its simplest mea
- Page 234 and 235:
Appendix (10) Interview Consultatio
- Page 236 and 237:
Line Transcript Text Open codeInter
- Page 238 and 239:
Line Transcript text Open codeParti
- Page 240 and 241:
contemporary techniques and methods
- Page 242 and 243:
..you may say the allowed…the ava
- Page 244 and 245:
Participant 1 : we dream of a day t
- Page 246 and 247:
Appendix (12) Questionnaire Consult
- Page 248 and 249:
Appendix (14) Permission (1)235
- Page 250 and 251:
Appendix (16) Focused Group Intervi
- Page 252 and 253:
3..73..7/6/21-6/35/6/33-6/18The Tra
- Page 254 and 255:
Content of Training Course Programm
- Page 256 and 257:
NoNo NeedLow NeedModerateNeedHighNe
- Page 258 and 259:
Part V: INSET programme Evaluation
- Page 260 and 261:
Appendix (21) Suggested Useful Webs
- Page 262:
بسن اهلل الرحوي الر