Ninth International Conference on Permafrost ... - IARC Research
Ninth International Conference on Permafrost ... - IARC Research
Ninth International Conference on Permafrost ... - IARC Research

You also want an ePaper? Increase the reach of your titles
YUMPU automatically turns print PDFs into web optimized ePapers that Google loves.
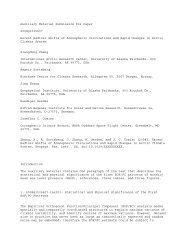
Patterns in Soil Carb<strong>on</strong> Distributi<strong>on</strong> in the Usa Basin (Russia): Linking SoilProperties to Envir<strong>on</strong>mental Variables in C<strong>on</strong>strained Gradient AnalysisGustaf Hugelius, Peter KuhryDepartment of Physical Geography and Quaternary Geology, Stockholm University, SwedenIntroducti<strong>on</strong>Arctic and subarctic ecosystems harbour large reservoirsof soil organic matter (SOM) and are c<strong>on</strong>sidered keycomp<strong>on</strong>ents in the global carb<strong>on</strong> (C) cycle (White et al.2000). To a large degree, this C is found in cryosols and cryichistosols, where subzero temperatures limits decompositi<strong>on</strong>(Davids<strong>on</strong> & Janssens 2006). We compile and analyse adatabase describing soil C properties, permafrost c<strong>on</strong>diti<strong>on</strong>s,and vegetati<strong>on</strong> in the Usa Basin of Northeastern EuropeanRussia. We update previous calculati<strong>on</strong>s of landscape soilC storage for the whole Usa Basin and describe generalpatterns of landscape C allocati<strong>on</strong> with respect to vegetati<strong>on</strong>and permafrost. We analyse a subset of the database inc<strong>on</strong>strained gradient analysis combined with M<strong>on</strong>te Carlopermutati<strong>on</strong>s to determine how an array of envir<strong>on</strong>mentalvariables are linked to site-specific soil quantity and quality.Study AreaThe Usa River Basin straddles the Arctic Circle inNortheastern European Russia, covering some 93,500 km 2 .Spruce dominated taiga covers the southern parts of thebasin and gradually gives way to open ground in a widetaiga-tundra transiti<strong>on</strong> z<strong>on</strong>e. Isolated permafrost first appearsin peatlands of this transiti<strong>on</strong> z<strong>on</strong>e, but increases as tundrabegins to dominate the landscape. The northern lowlandparts of the basin are dominated by tundra and peatland withextensive permafrost. Subalpine forests of Larch and Firgrow in the foothills of the Ural Mountains, which denotethe eastern border of the basin.MethodsThe analysed database c<strong>on</strong>tains soil chemical and physicaldescripti<strong>on</strong>s from 363 different sites and includes both uplandsoils and peat. For each site, the soil database lists vegetati<strong>on</strong>cover, soil type (FAO-WRB), depth of soil genetic horiz<strong>on</strong>s,top organics, and active layer (if permafrost is present).Carb<strong>on</strong> storage is calculated to 30 and 100 cm referencedepths in mineral soils and to full depth in peatlands. Fora subset of the database there is also data <strong>on</strong> nitrogen (N)c<strong>on</strong>tent. The C:N ratio of peat decreases as the material isdegraded and is c<strong>on</strong>sidered a useful proxy for quality (Kuhry& Vitt 1996). We also analyse a GIS database of the UsaBasin c<strong>on</strong>taining maps of soils (Mazhitova et al. 2003) andpermafrost (Oberman & Mazhitova, 2003) as well as 100m resoluti<strong>on</strong> Digital Elevati<strong>on</strong> Model (DEM) and a satelliteLand Cover Classificati<strong>on</strong> (LCC, 30*30m Landsat TM data,Virtanen et al. 2004). Climate data is interpolated fromthe 16 km grid of the HIRHAM regi<strong>on</strong>al climate model(Christensen & Kuhry 2000).AnalysesFor the purpose of Soil C calculati<strong>on</strong>s and upscaling, theUsa Basin is divided into ecoclimatic regi<strong>on</strong>s (Fig. 1). Thesites in the database are ordered according to regi<strong>on</strong> andvegetati<strong>on</strong>. Mean soil C c<strong>on</strong>tent is then calculated for eachvegetati<strong>on</strong> type in the separate regi<strong>on</strong>s. We also calculate theproporti<strong>on</strong> of C that is stored in Cryosols. The results areupscaled to full areal coverage using vegetati<strong>on</strong> data fromthe LCC.For a subset of lowland sites (n = 68), soil properties areanalysed with Redundancy Analysis (RDA). This c<strong>on</strong>strainedordinati<strong>on</strong> technique is used to assess the relati<strong>on</strong>shipswithin and between two separate data matrices of resp<strong>on</strong>seand envir<strong>on</strong>mental variables.For each ped<strong>on</strong>, a total of nine soil resp<strong>on</strong>se variablesare included: 1–3: Carb<strong>on</strong> storage (kgC/m 2 ) in threedepth intervals (0–30 cm, 30–100 cm, and >100 cm);4–6: percentage of C that is in top organics, in peat andin permafrost; 7: Bulk Density (BD, g/cm3); 8–9: C:Nratio of organic soil horiz<strong>on</strong>s and C:N ratio of mineral soilhoriz<strong>on</strong>s.The envir<strong>on</strong>mental variables permafrost, vegetati<strong>on</strong>, andsoil are available from field observati<strong>on</strong>s as well as geomaticsources. The Topographic Wetness Index is calculated froma DEM. Climate variables are derived from the HIRHAMmodel.We perform RDAs of the resp<strong>on</strong>se variables, separatelyusing each envir<strong>on</strong>mental variable to c<strong>on</strong>strain the ordinati<strong>on</strong>(software CANOCO 4.5). The explanatory power of eachFigure 1. Map showing the coverage of ecoclimatic regi<strong>on</strong>s in theUsa Basin with the HIRHAM grid, railway, and topography.105