Ninth International Conference on Permafrost ... - IARC Research
Ninth International Conference on Permafrost ... - IARC Research
Ninth International Conference on Permafrost ... - IARC Research

Create successful ePaper yourself
Turn your PDF publications into a flip-book with our unique Google optimized e-Paper software.
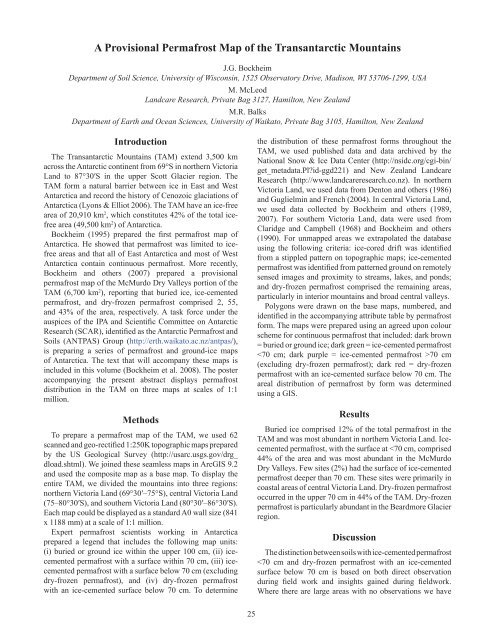
A Provisi<strong>on</strong>al <strong>Permafrost</strong> Map of the Transantarctic MountainsJ.G. BockheimDepartment of Soil Science, University of Wisc<strong>on</strong>sin, 1525 Observatory Drive, Madis<strong>on</strong>, WI 53706-1299, USAM. McLeodLandcare <strong>Research</strong>, Private Bag 3127, Hamilt<strong>on</strong>, New ZealandM.R. BalksDepartment of Earth and Ocean Sciences, University of Waikato, Private Bag 3105, Hamilt<strong>on</strong>, New ZealandIntroducti<strong>on</strong>The Transantarctic Mountains (TAM) extend 3,500 kmacross the Antarctic c<strong>on</strong>tinent from 69°S in northern VictoriaLand to 87°30′S in the upper Scott Glacier regi<strong>on</strong>. TheTAM form a natural barrier between ice in East and WestAntarctica and record the history of Cenozoic glaciati<strong>on</strong>s ofAntarctica (Ly<strong>on</strong>s & Elliot 2006). The TAM have an ice-freearea of 20,910 km 2 , which c<strong>on</strong>stitutes 42% of the total icefreearea (49,500 km 2 ) of Antarctica.Bockheim (1995) prepared the first permafrost map ofAntarctica. He showed that permafrost was limited to icefreeareas and that all of East Antarctica and most of WestAntarctica c<strong>on</strong>tain c<strong>on</strong>tinuous permafrost. More recently,Bockheim and others (2007) prepared a provisi<strong>on</strong>alpermafrost map of the McMurdo Dry Valleys porti<strong>on</strong> of theTAM (6,700 km 2 ), reporting that buried ice, ice-cementedpermafrost, and dry-frozen permafrost comprised 2, 55,and 43% of the area, respectively. A task force under theauspices of the IPA and Scientific Committee <strong>on</strong> Antarctic<strong>Research</strong> (SCAR), identified as the Antarctic <strong>Permafrost</strong> andSoils (ANTPAS) Group (http://erth.waikato.ac.nz/antpas/),is preparing a series of permafrost and ground-ice mapsof Antarctica. The text that will accompany these maps isincluded in this volume (Bockheim et al. 2008). The posteraccompanying the present abstract displays permafrostdistributi<strong>on</strong> in the TAM <strong>on</strong> three maps at scales of 1:1milli<strong>on</strong>.MethodsTo prepare a permafrost map of the TAM, we used 62scanned and geo-rectified 1:250K topographic maps preparedby the US Geological Survey (http://usarc.usgs.gov/drg_dload.shtml). We joined these seamless maps in ArcGIS 9.2and used the composite map as a base map. To display theentire TAM, we divided the mountains into three regi<strong>on</strong>s:northern Victoria Land (69°30′–75°S), central Victoria Land(75–80°30′S), and southern Victoria Land (80°30′–86°30′S).Each map could be displayed as a standard A0 wall size (841x 1188 mm) at a scale of 1:1 milli<strong>on</strong>.Expert permafrost scientists working in Antarcticaprepared a legend that includes the following map units:(i) buried or ground ice within the upper 100 cm, (ii) icecementedpermafrost with a surface within 70 cm, (iii) icecementedpermafrost with a surface below 70 cm (excludingdry-frozen permafrost), and (iv) dry-frozen permafrostwith an ice-cemented surface below 70 cm. To determinethe distributi<strong>on</strong> of these permafrost forms throughout theTAM, we used published data and data archived by theNati<strong>on</strong>al Snow & Ice Data Center (http://nsidc.org/cgi-bin/get_metadata.Pl?id-ggd221) and New Zealand Landcare<strong>Research</strong> (http://www.landcareresearch.co.nz). In northernVictoria Land, we used data from Dent<strong>on</strong> and others (1986)and Guglielmin and French (2004). In central Victoria Land,we used data collected by Bockheim and others (1989,2007). For southern Victoria Land, data were used fromClaridge and Campbell (1968) and Bockheim and others(1990). For unmapped areas we extrapolated the databaseusing the following criteria: ice-cored drift was identifiedfrom a stippled pattern <strong>on</strong> topographic maps; ice-cementedpermafrost was identified from patterned ground <strong>on</strong> remotelysensed images and proximity to streams, lakes, and p<strong>on</strong>ds;and dry-frozen permafrost comprised the remaining areas,particularly in interior mountains and broad central valleys.Polyg<strong>on</strong>s were drawn <strong>on</strong> the base maps, numbered, andidentified in the accompanying attribute table by permafrostform. The maps were prepared using an agreed up<strong>on</strong> colourscheme for c<strong>on</strong>tinuous permafrost that included: dark brown= buried or ground ice; dark green = ice-cemented permafrost70 cm(excluding dry-frozen permafrost); dark red = dry-frozenpermafrost with an ice-cemented surface below 70 cm. Theareal distributi<strong>on</strong> of permafrost by form was determinedusing a GIS.ResultsBuried ice comprised 12% of the total permafrost in theTAM and was most abundant in northern Victoria Land. Icecementedpermafrost, with the surface at