Ninth International Conference on Permafrost ... - IARC Research
Ninth International Conference on Permafrost ... - IARC Research
Ninth International Conference on Permafrost ... - IARC Research

Create successful ePaper yourself
Turn your PDF publications into a flip-book with our unique Google optimized e-Paper software.
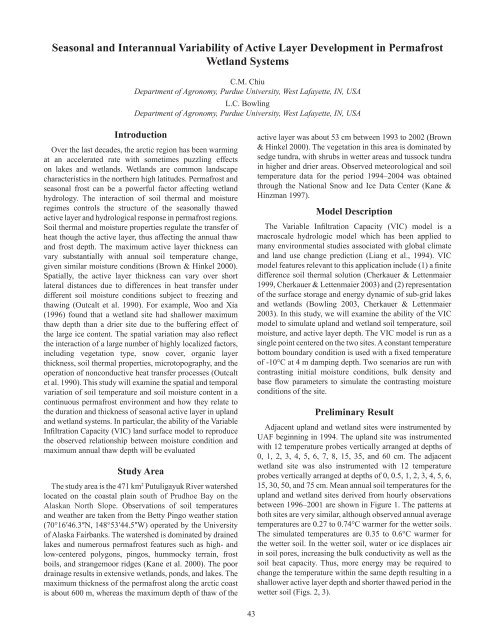
Seas<strong>on</strong>al and Interannual Variability of Active Layer Development in <strong>Permafrost</strong>Wetland SystemsC.M. ChiuDepartment of Agr<strong>on</strong>omy, Purdue University, West Lafayette, IN, USAL.C. BowlingDepartment of Agr<strong>on</strong>omy, Purdue University, West Lafayette, IN, USAIntroducti<strong>on</strong>Over the last decades, the arctic regi<strong>on</strong> has been warmingat an accelerated rate with sometimes puzzling effects<strong>on</strong> lakes and wetlands. Wetlands are comm<strong>on</strong> landscapecharacteristics in the northern high latitudes. <strong>Permafrost</strong> andseas<strong>on</strong>al frost can be a powerful factor affecting wetlandhydrology. The interacti<strong>on</strong> of soil thermal and moistureregimes c<strong>on</strong>trols the structure of the seas<strong>on</strong>ally thawedactive layer and hydrological resp<strong>on</strong>se in permafrost regi<strong>on</strong>s.Soil thermal and moisture properties regulate the transfer ofheat though the active layer, thus affecting the annual thawand frost depth. The maximum active layer thickness canvary substantially with annual soil temperature change,given similar moisture c<strong>on</strong>diti<strong>on</strong>s (Brown & Hinkel 2000).Spatially, the active layer thickness can vary over shortlateral distances due to differences in heat transfer underdifferent soil moisture c<strong>on</strong>diti<strong>on</strong>s subject to freezing andthawing (Outcalt et al. 1990). For example, Woo and Xia(1996) found that a wetland site had shallower maximumthaw depth than a drier site due to the buffering effect ofthe large ice c<strong>on</strong>tent. The spatial variati<strong>on</strong> may also reflectthe interacti<strong>on</strong> of a large number of highly localized factors,including vegetati<strong>on</strong> type, snow cover, organic layerthickness, soil thermal properties, microtopography, and theoperati<strong>on</strong> of n<strong>on</strong>c<strong>on</strong>ductive heat transfer processes (Outcaltet al. 1990). This study will examine the spatial and temporalvariati<strong>on</strong> of soil temperature and soil moisture c<strong>on</strong>tent in ac<strong>on</strong>tinuous permafrost envir<strong>on</strong>ment and how they relate tothe durati<strong>on</strong> and thickness of seas<strong>on</strong>al active layer in uplandand wetland systems. In particular, the ability of the VariableInfiltrati<strong>on</strong> Capacity (VIC) land surface model to reproducethe observed relati<strong>on</strong>ship between moisture c<strong>on</strong>diti<strong>on</strong> andmaximum annual thaw depth will be evaluatedStudy AreaThe study area is the 471 km 2 Putuligayuk River watershedlocated <strong>on</strong> the coastal plain south of Prudhoe Bay <strong>on</strong> theAlaskan North Slope. Observati<strong>on</strong>s of soil temperaturesand weather are taken from the Betty Pingo weather stati<strong>on</strong>(70°16′46.3ʺN, 148°53′44.5ʺW) operated by the Universityof Alaska Fairbanks. The watershed is dominated by drainedlakes and numerous permafrost features such as high- andlow-centered polyg<strong>on</strong>s, pingos, hummocky terrain, frostboils, and strangemoor ridges (Kane et al. 2000). The poordrainage results in extensive wetlands, p<strong>on</strong>ds, and lakes. Themaximum thickness of the permafrost al<strong>on</strong>g the arctic coastis about 600 m, whereas the maximum depth of thaw of theactive layer was about 53 cm between 1993 to 2002 (Brown& Hinkel 2000). The vegetati<strong>on</strong> in this area is dominated bysedge tundra, with shrubs in wetter areas and tussock tundrain higher and drier areas. Observed meteorological and soiltemperature data for the period 1994–2004 was obtainedthrough the Nati<strong>on</strong>al Snow and Ice Data Center (Kane &Hinzman 1997).Model Descripti<strong>on</strong>The Variable Infiltrati<strong>on</strong> Capacity (VIC) model is amacroscale hydrologic model which has been applied tomany envir<strong>on</strong>mental studies associated with global climateand land use change predicti<strong>on</strong> (Liang et al., 1994). VICmodel features relevant to this applicati<strong>on</strong> include (1) a finitedifference soil thermal soluti<strong>on</strong> (Cherkauer & Lettenmaier1999, Cherkauer & Lettenmaier 2003) and (2) representati<strong>on</strong>of the surface storage and energy dynamic of sub-grid lakesand wetlands (Bowling 2003, Cherkauer & Lettenmaier2003). In this study, we will examine the ability of the VICmodel to simulate upland and wetland soil temperature, soilmoisture, and active layer depth. The VIC model is run as asingle point centered <strong>on</strong> the two sites. A c<strong>on</strong>stant temperaturebottom boundary c<strong>on</strong>diti<strong>on</strong> is used with a fixed temperatureof -10°C at 4 m damping depth. Two scenarios are run withc<strong>on</strong>trasting initial moisture c<strong>on</strong>diti<strong>on</strong>s, bulk density andbase flow parameters to simulate the c<strong>on</strong>trasting moisturec<strong>on</strong>diti<strong>on</strong>s of the site.Preliminary ResultAdjacent upland and wetland sites were instrumented byUAF beginning in 1994. The upland site was instrumentedwith 12 temperature probes vertically arranged at depths of0, 1, 2, 3, 4, 5, 6, 7, 8, 15, 35, and 60 cm. The adjacentwetland site was also instrumented with 12 temperatureprobes vertically arranged at depths of 0, 0.5, 1, 2, 3, 4, 5, 6,15, 30, 50, and 75 cm. Mean annual soil temperatures for theupland and wetland sites derived from hourly observati<strong>on</strong>sbetween 1996–2001 are shown in Figure 1. The patterns atboth sites are very similar, although observed annual averagetemperatures are 0.27 to 0.74°C warmer for the wetter soils.The simulated temperatures are 0.35 to 0.6°C warmer forthe wetter soil. In the wetter soil, water or ice displaces airin soil pores, increasing the bulk c<strong>on</strong>ductivity as well as thesoil heat capacity. Thus, more energy may be required tochange the temperature within the same depth resulting in ashallower active layer depth and shorter thawed period in thewetter soil (Figs. 2, 3).43