- Page 1 and 2:
HEI-ILO Research Programme onStreng
- Page 3:
PrefaceThis three-volume series res
- Page 7 and 8:
Table of contentsPreface...........
- Page 9:
The Private Sector and Social Partn
- Page 13:
Executive summaryPrivate enterprise
- Page 16 and 17:
IGOs, NGOs—tend to exclude, or at
- Page 18 and 19:
• The World Bank has created a kn
- Page 20 and 21:
2. Private enterprises in conflict-
- Page 22 and 23:
Figure 1: The Private Sector Employ
- Page 24 and 25:
2.3. Case study: Promoting multi-et
- Page 26 and 27:
downstream, i.e. refining and distr
- Page 28 and 29:
Box 1: How does Somalia’s private
- Page 30 and 31:
Sectoral aspectsthere will be added
- Page 32 and 33:
inequities in pricing. “Of the 16
- Page 34 and 35:
into the armies are thereby also at
- Page 36 and 37:
3. Private enterprises and social p
- Page 38 and 39:
Two natural disasters which have be
- Page 40 and 41:
Box 4: Cooperatives in crisis respo
- Page 42 and 43:
partners, the tripartite cooperatio
- Page 44:
36forces and that are able to perfo
- Page 48:
AcknowledgmentsThe authors of this
- Page 51 and 52:
6.2. Delimiters of women’s econom
- Page 54 and 55:
Executive summaryDespite the rich n
- Page 56 and 57:
1. IntroductionSince 1979, under th
- Page 58 and 59:
2. Country profileThe Republic of I
- Page 60 and 61:
• activities related to reconstru
- Page 62 and 63:
for university education concerning
- Page 64 and 65:
2.4. Economic environment assessmen
- Page 66 and 67:
Unemployment (15 years of age and a
- Page 68 and 69:
2.5. PerspectivesDespite devastatio
- Page 70 and 71:
3. The rationale of SME sector deve
- Page 72 and 73:
4. Iraq's SME sector: A profile4.1.
- Page 74 and 75:
The Private sector employment pyram
- Page 76 and 77:
Table 8: Estimates of total formal
- Page 78 and 79:
Feasibility study: almost all respo
- Page 80 and 81:
Table 9: Percentage of female entre
- Page 82 and 83:
Factors for public sector preferenc
- Page 84 and 85:
The recessionary indication of busi
- Page 86 and 87:
Special investment legislation and
- Page 88 and 89:
8. Small entrepreneurs in Iraq: Sto
- Page 90 and 91:
a reasonable income and independenc
- Page 92 and 93:
9. RecommendationsSME-development s
- Page 94 and 95:
Longer-term SME developmentBesides
- Page 96 and 97:
• literature and artistic service
- Page 98 and 99:
2. List of interviews with governme
- Page 100 and 101:
11. Why did you decide establishing
- Page 102 and 103:
33. What are the cost components of
- Page 104 and 105:
59. Are you working on a project, o
- Page 106:
Promoting multi-ethnic stakeholder
- Page 109 and 110:
101
- Page 111 and 112:
103
- Page 113 and 114:
105
- Page 115 and 116:
107
- Page 117 and 118:
109
- Page 119 and 120:
Research methodologyThe research te
- Page 121 and 122:
possibility of conflict. In 1992, a
- Page 123 and 124:
2.2.2. PovertyAfter the break-up of
- Page 125 and 126:
of almost 10 per cent of GDP, yet i
- Page 127 and 128:
Source of initial financing: privat
- Page 129 and 130:
‘It is important to point out tha
- Page 131 and 132:
4.2. The economic resilience of int
- Page 133 and 134:
medium-sized companies employing 24
- Page 135 and 136:
5.2. Addressing constraints for SME
- Page 137 and 138:
5.4. Support to local initiativesSM
- Page 139 and 140:
ConclusionConsidering the actual an
- Page 141 and 142:
Scott, Norman: Macedonia: A Brief E
- Page 143 and 144:
Official gross reserves 4 290 450 7
- Page 145 and 146:
4. Survey questionnaire1. Name of t
- Page 147 and 148:
139
- Page 149 and 150:
141
- Page 151 and 152:
143
- Page 153 and 154:
2. Le contexte2.1. Le paradoxe ango
- Page 155 and 156:
Composition et description des Futu
- Page 157 and 158:
Les généraux angolais sont prése
- Page 159 and 160:
Les syndicats officielsL’Union na
- Page 161 and 162:
Une étude réalisée en 2003 pour
- Page 163 and 164:
3.3. Sortir du cercle vicieux : vie
- Page 165 and 166: Annexes1. Morceaux choisis : le «
- Page 167 and 168: 159
- Page 169 and 170: L’implication des partenaires soc
- Page 171 and 172: Table des matièresTable des matiè
- Page 173 and 174: RemerciementsQu’il me soit permis
- Page 175 and 176: Liste des acronymesAFASPAALEANEAANS
- Page 177 and 178: GlossaireAide d’urgence :Aléa :A
- Page 179 and 180: Résumé exécutifAu cours des dix
- Page 181 and 182: 1. IntroductionLe département de R
- Page 183 and 184: Limites de l’étudeAvant de proc
- Page 185 and 186: évalué à plus de deux milliards
- Page 187 and 188: 2.2.2. Aspects démographiquesLes p
- Page 189 and 190: 2.3.3. EducationDès l’indépenda
- Page 191 and 192: création de fonds de stabilisation
- Page 193 and 194: 3. Analyse des formes de réponse :
- Page 195 and 196: • le secteur de l’Eau sera dest
- Page 197 and 198: • la révision de la législation
- Page 199 and 200: de main-d’œuvre, encourageant la
- Page 201 and 202: leur fournissait les équipements e
- Page 203 and 204: matérielle sous des formes diverse
- Page 205 and 206: centre de l’attention des partena
- Page 207 and 208: • le rôle dévolu à la commissi
- Page 209 and 210: Renforcer le rôle de solidarité d
- Page 211 and 212: ConclusionLa dimension de la tache
- Page 213 and 214: Equipe Multidisciplinaire pour l’
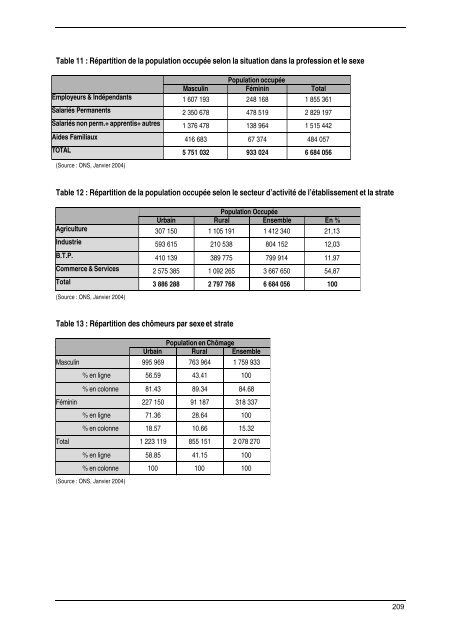
- Page 215: 2. Séries statistiquesTable 8 : Ev
- Page 219 and 220: Table 2 : Liste détaillée des com
- Page 221 and 222: Table 4 : Dispositif d’interventi
- Page 223 and 224: Organisation de l’unité syndical
- Page 225 and 226: - Centre technique de construction.
- Page 227: 219