MAINTAINABILITY DESIGN TECHNIQUES METRIC - AcqNotes.com
MAINTAINABILITY DESIGN TECHNIQUES METRIC - AcqNotes.com
MAINTAINABILITY DESIGN TECHNIQUES METRIC - AcqNotes.com

Create successful ePaper yourself
Turn your PDF publications into a flip-book with our unique Google optimized e-Paper software.
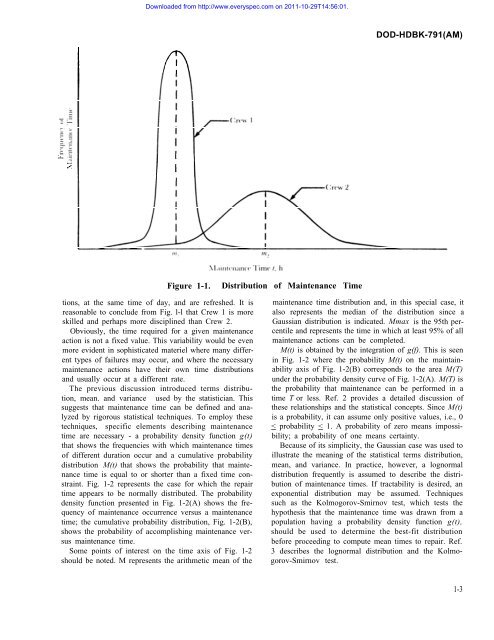
Downloaded from http://www.everyspec.<strong>com</strong> on 2011-10-29T14:56:01.DOD-HDBK-791(AM)Figure 1-1.Distribution of Maintenance Timetions, at the same time of day, and are refreshed. It isreasonable to conclude from Fig. l-l that Crew 1 is moreskilled and perhaps more disciplined than Crew 2.Obviously, the time required for a given maintenanceaction is not a fixed value. This variability would be evenmore evident in sophisticated materiel where many differenttypes of failures may occur, and where the necessarymaintenance actions have their own time distributionsand usually occur at a different rate.The previous discussion introduced terms distribution,mean. and variance used by the statistician. Thissuggests that maintenance time can be defined and analyzedby rigorous statistical techniques. To employ thesetechniques, specific elements describing maintenancetime are necessary - a probability density function g(t)that shows the frequencies with which maintenance timesof different duration occur and a cumulative probabilitydistribution M(t) that shows the probability that maintenancetime is equal to or shorter than a fixed time constraint.Fig. 1-2 represents the case for which the repairtime appears to be normally distributed. The probabilitydensity function presented in Fig. 1-2(A) shows the frequencyof maintenance occurrence versus a maintenancetime; the cumulative probability distribution, Fig. 1-2(B),shows the probability of ac<strong>com</strong>plishing maintenance versusmaintenance time.Some points of interest on the time axis of Fig. 1-2should be noted. M represents the arithmetic mean of themaintenance time distribution and, in this special case, italso represents the median of the distribution since aGaussian distribution is indicated. Mmax is the 95th percentileand represents the time in which at least 95% of allmaintenance actions can be <strong>com</strong>pleted.M(t) is obtained by the integration of g(f). This is seenin Fig. 1-2 where the probability M(t) on the maintainabilityaxis of Fig. 1-2(B) corresponds to the area M(T)under the probability density curve of Fig. 1-2(A). M(T) isthe probability that maintenance can be performed in atime T or less. Ref. 2 provides a detailed discussion ofthese relationships and the statistical concepts. Since M(t)is a probability, it can assume only positive values, i.e., 0< probability < 1. A probability of zero means impossibility;a probability of one means certainty.Because of its simplicity, the Gaussian case was used toillustrate the meaning of the statistical terms distribution,mean, and variance. In practice, however, a lognormaldistribution frequently is assumed to describe the distributionof maintenance times. If tractability is desired, anexponential distribution may be assumed. Techniquessuch as the Kolmogorov-Smirnov test, which tests thehypothesis that the maintenance time was drawn from apopulation having a probability density function g(t),should be used to determine the best-fit distributionbefore proceeding to <strong>com</strong>pute mean times to repair. Ref.3 describes the lognormal distribution and the Kolmogorov-Smirnovtest.1-3