MAINTAINABILITY DESIGN TECHNIQUES METRIC - AcqNotes.com
MAINTAINABILITY DESIGN TECHNIQUES METRIC - AcqNotes.com
MAINTAINABILITY DESIGN TECHNIQUES METRIC - AcqNotes.com

You also want an ePaper? Increase the reach of your titles
YUMPU automatically turns print PDFs into web optimized ePapers that Google loves.
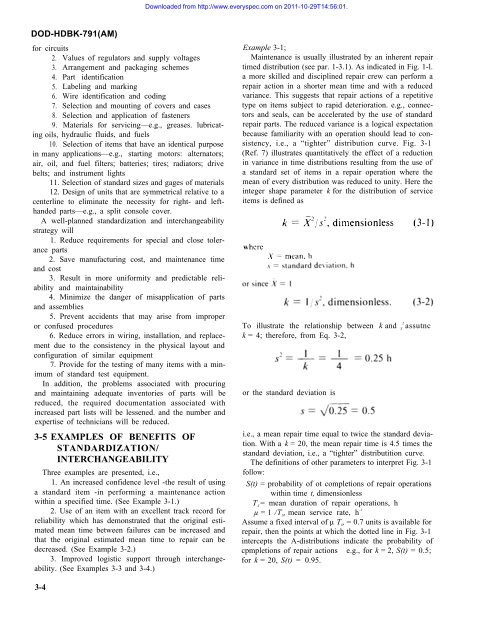
Downloaded from http://www.everyspec.<strong>com</strong> on 2011-10-29T14:56:01.DOD-HDBK-791(AM)for circuits2.3.4.5.6.7.8.9.ing oils,10.in manyValues of regulators and supply voltagesArrangement and packaging schemesPart identificationLabeling and markingWire identification and codingSelection and mounting of covers and casesSelection and application of fastenersMaterials for servicing—e.g., greases. lubricathydraulicfluids, and fuelsSelection of items that have an identical purposeapplications—e.g., starting motors: alternators;air, oil, and fuel filters; batteries; tires; radiators; drivebelts; and instrument lights11. Selection of standard sizes and gages of materials12. Design of units that are symmetrical relative to acenterline to eliminate the necessity for right- and lefthandedparts—e.g., a split console cover.A well-planned standardization and interchangeabilitystrategy will1. Reduce requirements for special and close toleranceparts2. Save manufacturing cost, and maintenance timeand cost3. Result in more uniformity and predictable reliabilityand maintainability4. Minimize the danger of misapplication of partsand assemblies5. Prevent accidents that may arise from improperor confused procedures6. Reduce errors in wiring, installation, and replacementdue to the consistency in the physical layout andconfiguration of similar equipment7. Provide for the testing of many items with a minimumof standard test equipment.In addition, the problems associated with procuringand maintaining adequate inventories of parts will bereduced, the required documentation associated withincreased part lists will be lessened. and the number andexpertise of technicians will be reduced.3-5 EXAMPLES OF BENEFITS OFSTANDARDIZATION/INTERCHANGEABILITYThree examples are presented, i.e.,1. An increased confidence level -the result of usinga standard item -in performing a maintenance actionwithin a specified time. (See Example 3-1.)2. Use of an item with an excellent track record forreliability which has demonstrated that the original estimatedmean time between failures can be increased andthat the original estimated mean time to repair can bedecreased. (See Example 3-2.)3. Improved logistic support through interchangeability.(See Examples 3-3 and 3-4.)Example 3-1;Maintenance is usually illustrated by an inherent repairtimed distribution (see par. 1-3.1). As indicated in Fig. 1-l.a more skilled and disciplined repair crew can perform arepair action in a shorter mean time and with a reducedvariance. This suggests that repair actions of a repetitivetype on items subject to rapid deterioration. e.g., connectorsand seals, can be accelerated by the use of standardrepair parts. The reduced variance is a logical expectationbecause familiarity with an operation should lead to consistency,i.e., a “tighter” distribution curve. Fig. 3-1(Ref. 7) illustrates quantitatively the effect of a reductionin variance in time distributions resulting from the use ofa standard set of items in a repair operation where themean of every distribution was reduced to unity. Here theinteger shape parameter k for the distribution of serviceitems is defined asTo illustrate the relationship between k and S2assutnck = 4; therefore, from Eq. 3-2,or the standard deviation isi.e., a mean repair time equal to twice the standard deviation.With a k = 20, the mean repair time is 4.5 times thestandard deviation, i.e., a “tighter” distributition curve.The definitions of other parameters to interpret Fig. 3-1follow:S(t) = probability of ot <strong>com</strong>pletions of repair operationswithin time t, dimensionlessT S= mean duration of repair operations, hµ = 1 /T S, mean service rate, h -1 .Assume a fixed interval of µ T S, = 0.7 units is available forrepair, then the points at which the dotted line in Fig. 3-1intercepts the A-distributions indicate the probability ofcpmpletions of repair actions e.g., for k = 2, S(t) = 0.5;for k = 20, S(t) = 0.95.3-4