Third IMO Greenhouse Gas Study 2014
GHG3%20Executive%20Summary%20and%20Report
GHG3%20Executive%20Summary%20and%20Report
Create successful ePaper yourself
Turn your PDF publications into a flip-book with our unique Google optimized e-Paper software.
Inventories of emissions of GHGs and other relevant substances 119<br />
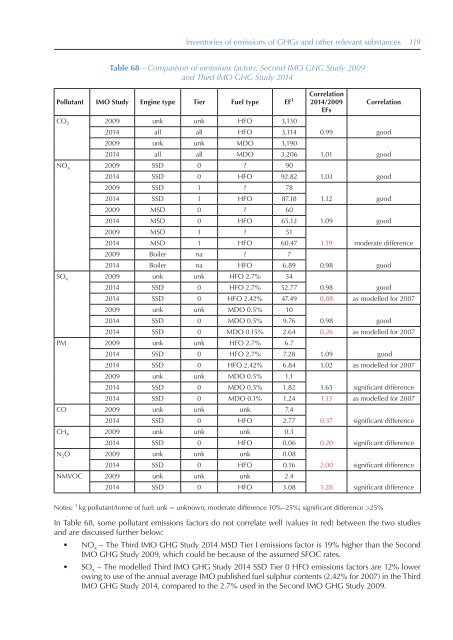
Table 68 – Comparison of emissions factors, Second <strong>IMO</strong> GHG <strong>Study</strong> 2009<br />
and <strong>Third</strong> <strong>IMO</strong> GHG <strong>Study</strong> <strong>2014</strong><br />
Pollutant <strong>IMO</strong> <strong>Study</strong> Engine type Tier Fuel type EF 1 <strong>2014</strong>/2009<br />
Correlation<br />
EFs<br />
CO 2 2009 unk unk HFO 3,130<br />
<strong>2014</strong> all all HFO 3,114<br />
2009 unk unk MDO 3,190<br />
<strong>2014</strong> all all MDO 3,206<br />
NO x 2009 SSD 0 ? 90<br />
<strong>2014</strong> SSD 0 HFO 92.82<br />
2009 SSD 1 ? 78<br />
<strong>2014</strong> SSD 1 HFO 87.18<br />
2009 MSD 0 ? 60<br />
<strong>2014</strong> MSD 0 HFO 65.12<br />
2009 MSD 1 ? 51<br />
<strong>2014</strong> MSD 1 HFO 60.47<br />
2009 Boiler na ? 7<br />
<strong>2014</strong> Boiler na HFO 6.89<br />
SO x 2009 unk unk HFO 2.7% 54<br />
<strong>2014</strong> SSD 0 HFO 2.7% 52.77<br />
Correlation<br />
0.99 good<br />
1.01 good<br />
1.03 good<br />
1.12 good<br />
1.09 good<br />
1.19 moderate difference<br />
0.98 good<br />
0.98 good<br />
<strong>2014</strong> SSD 0 HFO 2.42% 47.49 0.88 as modelled for 2007<br />
2009 unk unk MDO 0.5% 10<br />
<strong>2014</strong> SSD 0 MDO 0.5% 9.76<br />
0.98 good<br />
<strong>2014</strong> SSD 0 MDO 0.15% 2.64 0.26 as modelled for 2007<br />
PM 2009 unk unk HFO 2.7% 6.7<br />
<strong>2014</strong> SSD 0 HFO 2.7% 7.28<br />
1.09 good<br />
<strong>2014</strong> SSD 0 HFO 2.42% 6.84 1.02 as modelled for 2007<br />
2009 unk unk MDO 0.5% 1.1<br />
<strong>2014</strong> SSD 0 MDO 0.5% 1.82<br />
1.65 significant difference<br />
<strong>2014</strong> SSD 0 MDO 0.1% 1.24 1.13 as modelled for 2007<br />
CO 2009 unk unk unk 7.4<br />
<strong>2014</strong> SSD 0 HFO 2.77<br />
CH 4 2009 unk unk unk 0.3<br />
<strong>2014</strong> SSD 0 HFO 0.06<br />
N 2 O 2009 unk unk unk 0.08<br />
<strong>2014</strong> SSD 0 HFO 0.16<br />
NMVOC 2009 unk unk unk 2.4<br />
<strong>2014</strong> SSD 0 HFO 3.08<br />
0.37 significant difference<br />
0.20 significant difference<br />
2.00 significant difference<br />
1.28 significant difference<br />
Notes: 1 kg pollutant/tonne of fuel; unk = unknown; moderate difference 10%–25%; significant difference >25%<br />
In Table 68, some pollutant emissions factors do not correlate well (values in red) between the two studies<br />
and are discussed further below:<br />
• NO x – The <strong>Third</strong> <strong>IMO</strong> GHG <strong>Study</strong> <strong>2014</strong> MSD Tier I emissions factor is 19% higher than the Second<br />
<strong>IMO</strong> GHG <strong>Study</strong> 2009, which could be because of the assumed SFOC rates.<br />
• SO x – The modelled <strong>Third</strong> <strong>IMO</strong> GHG <strong>Study</strong> <strong>2014</strong> SSD Tier 0 HFO emissions factors are 12% lower<br />
owing to use of the annual average <strong>IMO</strong> published fuel sulphur contents (2.42% for 2007) in the <strong>Third</strong><br />
<strong>IMO</strong> GHG <strong>Study</strong> <strong>2014</strong>, compared to the 2.7% used in the Second <strong>IMO</strong> GHG <strong>Study</strong> 2009.


