- Page 4 and 5:
Preface Since the publication of th
- Page 6 and 7:
Chapter 1 Introduction This introdu
- Page 8 and 9:
1.2. Fiber Characteristics 3 Figure
- Page 10 and 11:
1.2. Fiber Characteristics 5 Figure
- Page 12 and 13:
1.2. Fiber Characteristics 7 1.49 1
- Page 14 and 15:
1.2. Fiber Characteristics 9 Figure
- Page 16 and 17:
1.2. Fiber Characteristics 11 faste
- Page 18 and 19:
1.3. Fiber Nonlinearities 13 Figure
- Page 20 and 21:
1.3. Fiber Nonlinearities 15 Sectio
- Page 22 and 23:
1.3. Fiber Nonlinearities 17 1.3.3
- Page 24 and 25:
1.4. Overview 19 briefly. The last
- Page 26 and 27:
References 21 1.11 Equation (1.3.2)
- Page 28 and 29:
References 23 [63] M. Ibanescu, Y.
- Page 30 and 31:
Chapter 2 Pulse Propagation in Fibe
- Page 32 and 33:
2.2. Fiber Modes 27 where Ẽ(r,ω)
- Page 34 and 35:
2.2. Fiber Modes 29 across the core
- Page 36 and 37:
2.3. Pulse-Propagation Equation 31
- Page 38 and 39:
2.3. Pulse-Propagation Equation 33
- Page 40 and 41:
2.3. Pulse-Propagation Equation 35
- Page 42 and 43:
2.3. Pulse-Propagation Equation 37
- Page 44 and 45:
2.3. Pulse-Propagation Equation 39
- Page 46 and 47:
2.4. Numerical Methods 41 Equation
- Page 48 and 49:
2.4. Numerical Methods 43 Figure 2.
- Page 50 and 51:
2.4. Numerical Methods 45 the basic
- Page 52 and 53:
References 47 2.5 Derive an express
- Page 54 and 55:
References 49 [44] V. I. Karpman an
- Page 56 and 57:
Chapter 3 Group-Velocity Dispersion
- Page 58 and 59:
3.2. Dispersion-Induced Pulse Broad
- Page 60 and 61:
3.2. Dispersion-Induced Pulse Broad
- Page 62 and 63:
3.2. Dispersion-Induced Pulse Broad
- Page 64 and 65:
3.2. Dispersion-Induced Pulse Broad
- Page 66 and 67:
3.2. Dispersion-Induced Pulse Broad
- Page 68 and 69:
3.3. Third-Order Dispersion 63 This
- Page 70 and 71:
3.3. Third-Order Dispersion 65 Figu
- Page 72 and 73:
3.3. Third-Order Dispersion 67 6 5
- Page 74 and 75:
3.3. Third-Order Dispersion 69 Noti
- Page 76 and 77:
3.4. Dispersion Management 71 Figur
- Page 78 and 79:
3.4. Dispersion Management 73 10 3
- Page 80 and 81:
3.4. Dispersion Management 75 Figur
- Page 82 and 83:
References 77 3.10 An optical commu
- Page 84 and 85:
Chapter 4 Self-Phase Modulation An
- Page 86 and 87:
4.1. SPM-Induced Spectral Changes 8
- Page 88 and 89:
4.1. SPM-Induced Spectral Changes 8
- Page 90 and 91:
4.1. SPM-Induced Spectral Changes 8
- Page 92 and 93:
4.1. SPM-Induced Spectral Changes 8
- Page 94 and 95:
4.2. Effect of Group-Velocity Dispe
- Page 96 and 97:
4.2. Effect of Group-Velocity Dispe
- Page 98 and 99:
4.2. Effect of Group-Velocity Dispe
- Page 100 and 101:
4.2. Effect of Group-Velocity Dispe
- Page 102 and 103:
4.2. Effect of Group-Velocity Dispe
- Page 104 and 105:
4.2. Effect of Group-Velocity Dispe
- Page 106 and 107:
4.2. Effect of Group-Velocity Dispe
- Page 108 and 109:
4.3. Semianalytic Techniques 103 In
- Page 110 and 111:
4.3. Semianalytic Techniques 105 (1
- Page 112 and 113:
4.4. Higher-Order Nonlinear Effects
- Page 114 and 115:
4.4. Higher-Order Nonlinear Effects
- Page 116 and 117:
4.4. Higher-Order Nonlinear Effects
- Page 118 and 119:
4.4. Higher-Order Nonlinear Effects
- Page 120 and 121:
Problems 115 4.2 Plot the spectrum
- Page 122 and 123:
References 117 [40] D. Marcuse, J.
- Page 124 and 125:
References 119 [109] J. Santhanam a
- Page 126 and 127:
5.1. Modulation Instability 121 of
- Page 128 and 129:
5.1. Modulation Instability 123 2 L
- Page 130 and 131:
5.1. Modulation Instability 125 Fig
- Page 132 and 133:
5.1. Modulation Instability 127 Fig
- Page 134 and 135:
5.2. Fiber Solitons 129 Figure 5.5:
- Page 136 and 137:
5.2. Fiber Solitons 131 and write i
- Page 138 and 139:
5.2. Fiber Solitons 133 Physically,
- Page 140 and 141:
5.2. Fiber Solitons 135 Figure 5.6:
- Page 142 and 143:
5.2. Fiber Solitons 137 Figure 5.7:
- Page 144 and 145:
5.2. Fiber Solitons 139 Figure 5.9:
- Page 146 and 147:
5.3. Other Types of Solitons 141 1
- Page 148 and 149:
5.3. Other Types of Solitons 143 pr
- Page 150 and 151:
5.3. Other Types of Solitons 145 Th
- Page 152 and 153:
5.4. Perturbation of Solitons 147 w
- Page 154 and 155:
5.4. Perturbation of Solitons 149 w
- Page 156 and 157:
5.4. Perturbation of Solitons 151 t
- Page 158 and 159:
5.4. Perturbation of Solitons 153 b
- Page 160 and 161:
5.4. Perturbation of Solitons 155 F
- Page 162 and 163:
5.5. Higher-Order Effects 157 where
- Page 164 and 165:
5.5. Higher-Order Effects 159 Figur
- Page 166 and 167:
5.5. Higher-Order Effects 161 1 N =
- Page 168 and 169:
5.5. Higher-Order Effects 163 Integ
- Page 170 and 171:
5.5. Higher-Order Effects 165 Figur
- Page 172 and 173:
5.5. Higher-Order Effects 167 that
- Page 174 and 175:
Problems 169 Problems 5.1 Solve Eq.
- Page 176 and 177:
References 171 [27] E. Brainis, D.
- Page 178 and 179:
References 173 [93] L. F. Mollenaue
- Page 180 and 181:
References 175 [165] V. V. Afanasje
- Page 182 and 183:
Chapter 6 Polarization Effects As d
- Page 184 and 185:
6.1. Nonlinear Birefringence 179 wh
- Page 186 and 187:
6.1. Nonlinear Birefringence 181 re
- Page 188 and 189:
6.2. Nonlinear Phase Shift 183 dA y
- Page 190 and 191:
6.2. Nonlinear Phase Shift 185 wher
- Page 192 and 193:
6.2. Nonlinear Phase Shift 187 side
- Page 194 and 195:
6.3. Evolution of Polarization Stat
- Page 196 and 197:
6.3. Evolution of Polarization Stat
- Page 198 and 199:
6.3. Evolution of Polarization Stat
- Page 200 and 201:
6.3. Evolution of Polarization Stat
- Page 202 and 203:
6.4. Vector Modulation Instability
- Page 204 and 205:
6.4. Vector Modulation Instability
- Page 206 and 207:
6.4. Vector Modulation Instability
- Page 208 and 209:
6.4. Vector Modulation Instability
- Page 210 and 211:
6.4. Vector Modulation Instability
- Page 212 and 213:
6.5. Birefringence and Solitons 207
- Page 214 and 215:
6.5. Birefringence and Solitons 209
- Page 216 and 217:
6.5. Birefringence and Solitons 211
- Page 218 and 219:
6.6. Random Birefringence 213 where
- Page 220 and 221:
6.6. Random Birefringence 215 PMD,
- Page 222 and 223:
6.6. Random Birefringence 217 As in
- Page 224 and 225:
6.6. Random Birefringence 219 Figur
- Page 226 and 227:
References 221 6.9 Derive the dispe
- Page 228 and 229:
References 223 [63] P. Kockaert, M.
- Page 230 and 231:
References 225 [140] A. El Amari, N
- Page 232 and 233:
7.1. XPM-Induced Nonlinear Coupling
- Page 234 and 235:
7.2. XPM-Induced Modulation Instabi
- Page 236 and 237:
7.2. XPM-Induced Modulation Instabi
- Page 238 and 239:
7.3. XPM-Paired Solitons 233 This t
- Page 240 and 241:
7.3. XPM-Paired Solitons 235 The co
- Page 242 and 243:
7.3. XPM-Paired Solitons 237 It is
- Page 244 and 245:
7.4. Spectral and Temporal Effects
- Page 246 and 247:
7.4. Spectral and Temporal Effects
- Page 248 and 249:
7.4. Spectral and Temporal Effects
- Page 250 and 251:
7.4. Spectral and Temporal Effects
- Page 252 and 253:
7.4. Spectral and Temporal Effects
- Page 254 and 255:
7.5. Applications of XPM 249 Probe
- Page 256 and 257:
7.5. Applications of XPM 251 by hig
- Page 258 and 259:
7.5. Applications of XPM 253 Figure
- Page 260 and 261:
7.6. Polarization Effects 255 where
- Page 262 and 263:
7.6. Polarization Effects 257 Figur
- Page 264 and 265:
7.6. Polarization Effects 259 1 0.8
- Page 266 and 267:
7.6. Polarization Effects 261 4 Pum
- Page 268 and 269:
7.6. Polarization Effects 263 Figur
- Page 270 and 271:
7.7. XPM Effects in Birefringent Fi
- Page 272 and 273:
7.7. XPM Effects in Birefringent Fi
- Page 274 and 275:
Problems 269 7.2 Derive the dispers
- Page 276 and 277:
References 271 [33] M. Lisak, A. H
- Page 278 and 279:
References 273 [105] B. V. Vu, A. S
- Page 280 and 281:
8.1. Basic Concepts 275 Figure 8.1:
- Page 282 and 283:
8.1. Basic Concepts 277 set of two
- Page 284 and 285:
8.1. Basic Concepts 279 10 mW. Howe
- Page 286 and 287:
8.1. Basic Concepts 281 0.5 Raman R
- Page 288 and 289:
8.2. Quasi-Continuous SRS 283 four
- Page 290 and 291:
8.2. Quasi-Continuous SRS 285 Figur
- Page 292 and 293:
8.2. Quasi-Continuous SRS 287 Figur
- Page 294 and 295:
8.2. Quasi-Continuous SRS 289 Figur
- Page 296 and 297:
8.2. Quasi-Continuous SRS 291 wavel
- Page 298 and 299:
8.2. Quasi-Continuous SRS 293 1 0.8
- Page 300 and 301:
8.3. SRS with Short Pump Pulses 295
- Page 302 and 303:
8.3. SRS with Short Pump Pulses 297
- Page 304 and 305:
8.3. SRS with Short Pump Pulses 299
- Page 306 and 307:
8.3. SRS with Short Pump Pulses 301
- Page 308 and 309:
8.3. SRS with Short Pump Pulses 303
- Page 310 and 311:
8.3. SRS with Short Pump Pulses 305
- Page 312 and 313:
8.4. Soliton Effects 307 Figure 8.1
- Page 314 and 315:
8.4. Soliton Effects 309 Figure 8.2
- Page 316 and 317:
8.4. Soliton Effects 311 Figure 8.2
- Page 318 and 319:
8.4. Soliton Effects 313 ton laser
- Page 320 and 321:
8.5. Polarization Effects 315 maxim
- Page 322 and 323:
8.5. Polarization Effects 317 where
- Page 324 and 325:
8.5. Polarization Effects 319 and s
- Page 326 and 327:
Problems 321 Figure 8.25: (a) Avera
- Page 328 and 329:
References 323 [4] W. Kaiser and M
- Page 330 and 331:
References 325 [75] M. Nakazawa, T.
- Page 332 and 333:
References 327 [144] V. I. Kruglov,
- Page 334 and 335:
Chapter 9 Stimulated Brillouin Scat
- Page 336 and 337:
9.1. Basic Concepts 331 Figure 9.1:
- Page 338 and 339:
9.2. Quasi-CW SBS 333 [20]. A part
- Page 340 and 341:
9.2. Quasi-CW SBS 335 (see Figure 8
- Page 342 and 343:
9.2. Quasi-CW SBS 337 pseudorandom
- Page 344 and 345:
9.2. Quasi-CW SBS 339 Figure 9.4: S
- Page 346 and 347:
9.3. Brillouin Fiber Amplifiers 341
- Page 348 and 349:
9.3. Brillouin Fiber Amplifiers 343
- Page 350 and 351:
9.4. SBS Dynamics 345 9.4.1 Coupled
- Page 352 and 353:
9.4. SBS Dynamics 347 Pump Power (k
- Page 354 and 355:
9.4. SBS Dynamics 349 Figure 9.11:
- Page 356 and 357:
9.4. SBS Dynamics 351 Δn SBS . If
- Page 358 and 359:
9.4. SBS Dynamics 353 Figure 9.14:
- Page 360 and 361:
9.4. SBS Dynamics 355 Figure 9.16:
- Page 362 and 363:
9.5. Brillouin Fiber Lasers 357 Fig
- Page 364 and 365:
9.5. Brillouin Fiber Lasers 359 Fig
- Page 366 and 367:
9.5. Brillouin Fiber Lasers 361 rin
- Page 368 and 369:
References 363 9.4 Estimate SBS thr
- Page 370 and 371:
References 365 [47] Y.-X. Fan, F.-Y
- Page 372 and 373:
References 367 [119] R. G. Harrison
- Page 374 and 375:
10.1. Origin of Four-Wave Mixing 36
- Page 376 and 377:
10.2. Theory of Four-Wave Mixing 37
- Page 378 and 379:
10.2. Theory of Four-Wave Mixing 37
- Page 380 and 381:
10.2. Theory of Four-Wave Mixing 37
- Page 382 and 383:
10.3. Phase-Matching Techniques 377
- Page 384 and 385:
10.3. Phase-Matching Techniques 379
- Page 386 and 387:
10.3. Phase-Matching Techniques 381
- Page 388 and 389:
10.3. Phase-Matching Techniques 383
- Page 390 and 391:
10.3. Phase-Matching Techniques 385
- Page 392 and 393:
10.4. Parametric Amplification 387
- Page 394 and 395:
10.4. Parametric Amplification 389
- Page 396 and 397:
10.4. Parametric Amplification 391
- Page 398 and 399:
10.4. Parametric Amplification 393
- Page 400 and 401:
10.4. Parametric Amplification 395
- Page 402 and 403:
10.4. Parametric Amplification 397
- Page 404 and 405:
10.4. Parametric Amplification 399
- Page 406 and 407:
10.5. Polarization Effects 401 Bril
- Page 408 and 409:
10.5. Polarization Effects 403 foll
- Page 410 and 411:
10.5. Polarization Effects 405 Jone
- Page 412 and 413:
10.5. Polarization Effects 407 to s
- Page 414 and 415:
10.5. Polarization Effects 409 Figu
- Page 416 and 417:
10.6. Applications of Four-Wave Mix
- Page 418 and 419:
10.6. Applications of Four-Wave Mix
- Page 420 and 421:
10.6. Applications of Four-Wave Mix
- Page 422 and 423:
Problems 417 Figure 10.24: Output s
- Page 424 and 425:
References 419 [5] R. W. Boyd, Nonl
- Page 426 and 427:
References 421 [79] A. Durécu-Legr
- Page 428 and 429:
References 423 [140] M. D. Levenson
- Page 430 and 431: 11.1. Nonlinear Parameter 425 11.1.
- Page 432 and 433: 11.1. Nonlinear Parameter 427 Figur
- Page 434 and 435: 11.1. Nonlinear Parameter 429 Figur
- Page 436 and 437: 11.1. Nonlinear Parameter 431 Figur
- Page 438 and 439: 11.1. Nonlinear Parameter 433 when
- Page 440 and 441: 11.2. Fibers with Silica Cladding 4
- Page 442 and 443: 11.3. Tapered Fibers with Air Cladd
- Page 444 and 445: 11.3. Tapered Fibers with Air Cladd
- Page 446 and 447: 11.4. Microstructured Fibers 441 he
- Page 448 and 449: 11.4. Microstructured Fibers 443 Ef
- Page 450 and 451: 11.5. Non-Silica Fibers 445 0.05 0.
- Page 452 and 453: 11.5. Non-Silica Fibers 447 Figure
- Page 454 and 455: References 449 wavelength range of
- Page 456 and 457: References 451 [57] H. Yokota, E. S
- Page 458 and 459: Chapter 12 Novel Nonlinear Phenomen
- Page 460 and 461: 12.1. Intrapulse Raman Scattering 4
- Page 462 and 463: 12.1. Intrapulse Raman Scattering 4
- Page 464 and 465: 12.1. Intrapulse Raman Scattering 4
- Page 466 and 467: 12.1. Intrapulse Raman Scattering 4
- Page 468 and 469: 12.1. Intrapulse Raman Scattering 4
- Page 470 and 471: 12.2. Four-Wave Mixing 465 Figure 1
- Page 472 and 473: 12.2. Four-Wave Mixing 467 Figure 1
- Page 474 and 475: 12.3. Supercontinuum Generation 469
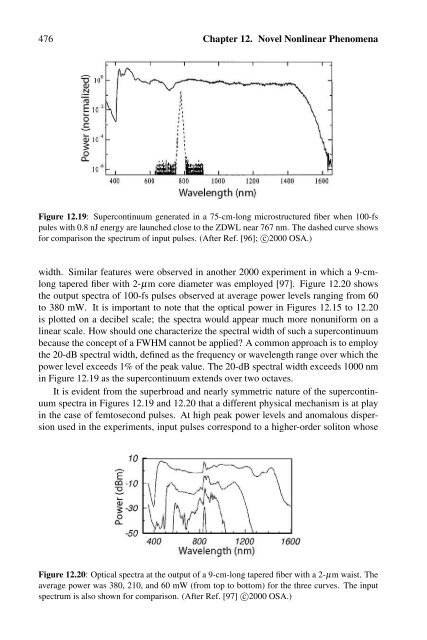
- Page 476 and 477: 12.3. Supercontinuum Generation 471
- Page 478 and 479: 12.3. Supercontinuum Generation 473
- Page 482 and 483: 12.4. Temporal and Spectral Evoluti
- Page 484 and 485: 12.4. Temporal and Spectral Evoluti
- Page 486 and 487: 12.4. Temporal and Spectral Evoluti
- Page 488 and 489: 12.4. Temporal and Spectral Evoluti
- Page 490 and 491: 12.4. Temporal and Spectral Evoluti
- Page 492 and 493: 12.4. Temporal and Spectral Evoluti
- Page 494 and 495: 12.4. Temporal and Spectral Evoluti
- Page 496 and 497: 12.4. Temporal and Spectral Evoluti
- Page 498 and 499: 12.4. Temporal and Spectral Evoluti
- Page 500 and 501: 12.5. Harmonic Generation 495 Figur
- Page 502 and 503: 12.5. Harmonic Generation 497 traps
- Page 504 and 505: 12.5. Harmonic Generation 499 Figur
- Page 506 and 507: 12.5. Harmonic Generation 501 analy
- Page 508 and 509: 12.5. Harmonic Generation 503 Figur
- Page 510 and 511: 12.5. Harmonic Generation 505 The p
- Page 512 and 513: References 507 12.6 Derive an expre
- Page 514 and 515: References 509 [45] J. E. Sharping,
- Page 516 and 517: References 511 [111] J. Y. Y. Leong
- Page 518 and 519: References 513 [180] A. L. Calvez,
- Page 520 and 521: Appendix A 515 converted into decib
- Page 522 and 523: Appendix B 517 % This code solves t
- Page 524 and 525: Appendix C List of Acronyms Each sc
- Page 526 and 527: Index acoustic response function, 4
- Page 528 and 529: Index 523 distributed fiber sensors
- Page 530 and 531:
Index 525 four-photon, 412 gain-swi
- Page 532 and 533:
Index 527 Raman amplification with,
- Page 534:
Index 529 spectral hole burning, 36