VINCI - 2008 annual report
VINCI - 2008 annual report
VINCI - 2008 annual report

Create successful ePaper yourself
Turn your PDF publications into a flip-book with our unique Google optimized e-Paper software.
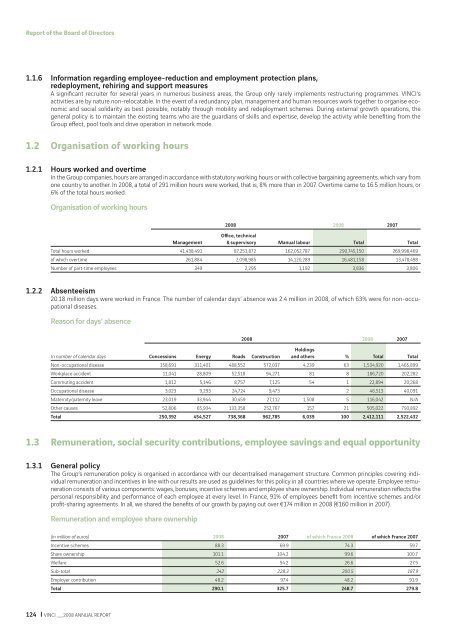
Report of the Board of Directors<br />
1.1.6 Information regarding employee-reduction and employment protection plans,<br />
redeployment, rehiring and support measures<br />
A signifi cant recruiter for several years in numerous business areas, the Group only rarely implements restructuring programmes. <strong>VINCI</strong>’s<br />
activities are by nature non-relocatable. In the event of a redundancy plan, management and human resources work together to organise economic<br />
and social solidarity as best possible, notably through mobility and redeployment schemes. During external growth operations, the<br />
general policy is to maintain the existing teams who are the guardians of skills and expertise, develop the activity while benefi ting from the<br />
Group eff ect, pool tools and drive operation in network mode.<br />
1.2 Organisation of working hours<br />
1.2.1 Hours worked and overtime<br />
In the Group companies, hours are arranged in accordance with statutory working hours or with collective bargaining agreements, which vary from<br />
one country to another. In <strong>2008</strong>, a total of 291 million hours were worked, that is, 8% more than in 2007. Overtime came to 16.5 million hours, or<br />
6% of the total hours worked.<br />
Organisation of working hours<br />
124 <strong>VINCI</strong> __ <strong>2008</strong> ANNUAL REPORT<br />
Management<br />
<strong>2008</strong> <strong>2008</strong> 2007<br />
Offi ce, technical<br />
& supervisory Manual labour Total Total<br />
Total hours worked 41,438,491 87,253,872 162,052,787 290,745,150 269,998,469<br />
of which overtime 261,884 2,098,985 14,120,289 16,481,158 13,478,498<br />
Number of part-time employees 349 2,295 1,192 3,836 3,806<br />
1.2.2 Absenteeism<br />
20.18 million days were worked in France. The number of calendar days’ absence was 2.4 million in <strong>2008</strong>, of which 63% were for non-occupational<br />
diseases.<br />
Reason for days’ absence<br />
In number of calendar days<br />
Concessions Energy Roads Construction<br />
<strong>2008</strong> <strong>2008</strong> 2007<br />
Holdings<br />
and others % Total Total<br />
Non-occupational disease 158,691 311,401 488,552 572,037 4,239 63 1,534,920 1,465,899<br />
Workplace accident 11,041 28,809 52,518 94,271 81 8 186,720 202,282<br />
Commuting accident 1,812 5,146 8,757 7,125 54 1 22,894 20,268<br />
Occupational disease 3,023 9,293 24,724 9,473 2 46,513 40,091<br />
Maternity/paternity leave 23,019 33,944 30,459 27,112 1,508 5 116,042 N/A<br />
Other causes 52,806 65,934 133,358 252,767 157 21 505,022 793,892<br />
Total 250,392 454,527 738,368 962,785 6,039 100 2,412,111 2,522,432<br />
1.3 Remuneration, social security contributions, employee savings and equal opportunity<br />
1.3.1 General policy<br />
The Group’s remuneration policy is organised in accordance with our decentralised management structure. Common principles covering individual<br />
remuneration and incentives in line with our results are used as guidelines for this policy in all countries where we operate. Employee remuneration<br />
consists of various components: wages, bonuses, incentive schemes and employee share ownership. Individual remuneration refl ects the<br />
personal responsibility and performance of each employee at every level. In France, 91% of employees benefi t from incentive schemes and/or<br />
profi t-sharing agreements. In all, we shared the benefi ts of our growth by paying out over €174 million in <strong>2008</strong> (€160 million in 2007).<br />
Remuneration and employee share ownership<br />
(in million of euros) <strong>2008</strong> 2007 of which France <strong>2008</strong> of which France 2007<br />
Incentive schemes 88.3 69.9 74.3 59.7<br />
Share ownership 101.1 104.2 99.6 100.7<br />
Welfare 52.6 54.2 26.6 27.5<br />
Sub-total 242 228.3 200.5 187.9<br />
Employer contribution 48.2 97.4 48.2 91.9<br />
Total 290.1 325.7 248.7 279.8