VINCI - 2008 annual report
VINCI - 2008 annual report
VINCI - 2008 annual report

Create successful ePaper yourself
Turn your PDF publications into a flip-book with our unique Google optimized e-Paper software.
Consolidated fi nancial statements<br />
Contracting:<br />
– Energy: electrical works and engineering, information and communication technology, heating ventilation and air conditioning engineering,<br />
insulation.<br />
– Roads: building and maintenance of roads and motorways, production of road-building materials, urban infrastructure, environmental work,<br />
demolition and recycling.<br />
– Construction: design and construction of buildings and infrastructure in the civil engineering sector, hydraulic works, multi-technical maintenance,<br />
foundations, soil treatment and dredging.<br />
The segment fi nancial information has been prepared using the same accounting rules as for the full fi nancial statements.<br />
Transactions between the various business lines are carried out at market conditions.<br />
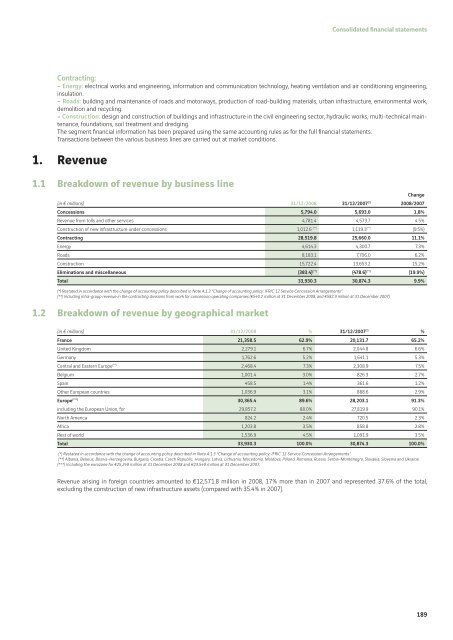
1. Revenue<br />
1.1 Breakdown of revenue by business line<br />
(in € millions) 31/12/<strong>2008</strong> 31/12/2007 (*)<br />
Change<br />
<strong>2008</strong>/2007<br />
Concessions 5,794.0 5,693.0 1.8%<br />
Revenue from tolls and other services 4,781.4 4,573.7 4.5%<br />
Construction of new infrastructure under concessions 1,012.6 (**) 1,119.3 (**) (9.5%)<br />
Contracting 28,519.8 25,660.0 11.1%<br />
Energy 4,614.3 4,300.7 7.3%<br />
Roads 8,183.1 7,706.0 6.2%<br />
Construction 15,722.4 13,653.2 15.2%<br />
Eliminations and miscellaneous (383.4) (**) (478.6) (**) (19.9%)<br />
Total 33,930.3 30,874.3 9.9%<br />
(*) Restated in accordance with the change of accounting policy described in Note A.1.3 “Change of accounting policy: IFRIC 12 Service Concession Arrangements”.<br />
(**) Including intra-group revenue in the contracting divisions from work for concession operating companies (€540.2 million at 31 December <strong>2008</strong>, and €582.9 million at 31 December 2007).<br />
1.2 Breakdown of revenue by geographical market<br />
(in € millions) 31/12/<strong>2008</strong> % 31/12/2007 (*) %<br />
France 21,358.5 62.9% 20,131.7 65.2%<br />
United Kingdom 2,279.1 6.7% 2,044.8 6.6%<br />
Germany 1,762.6 5.2% 1,641.1 5.3%<br />
Central and Eastern Europe (**) 2,468.4 7.3% 2,308.9 7.5%<br />
Belgium 1,001.4 3.0% 826.3 2.7%<br />
Spain 458.5 1.4% 361.6 1.2%<br />
Other European countries 1,036.9 3.1% 888.6 2.9%<br />
Europe (***) 30,365.4 89.6% 28,203.1 91.3%<br />
including the European Union, for 29,857.2 88.0% 27,819.9 90.1%<br />
North America 824.2 2.4% 720.5 2.3%<br />
Africa 1,203.8 3.5% 858.8 2.8%<br />
Rest of world 1,536.9 4.5% 1,091.9 3.5%<br />
Total 33,930.3 100.0% 30,874.3 100.0%<br />
(*) Restated in accordance with the change of accounting policy described in Note A.1.3 “Change of accounting policy: IFRIC 12 Service Concession Arrangements”.<br />
(**) Albania, Belarus, Bosnia-Herzegovina, Bulgaria, Croatia, Czech Republic, Hungary, Latvia, Lithuania, Macedonia, Moldova, Poland, Romania, Russia, Serbia-Montenegro, Slovakia, Slovenia and Ukraine.<br />
(***) Including the eurozone for €25,249 million at 31 December <strong>2008</strong> and €23,540 million at 31 December 2007.<br />
Revenue arising in foreign countries amounted to €12,571.8 million in <strong>2008</strong>, 17% more than in 2007 and represented 37.6% of the total,<br />
excluding the construction of new infrastructure assets (compared with 35.4% in 2007).<br />
189