- Page 1: Amadeus IT Holding, S.A. and Subsid
- Page 4 and 5: AMADEUS IT HOLDING, S.A. AND SUBSID
- Page 6 and 7: AMADEUS IT HOLDING, S.A. AND SUBSID
- Page 8 and 9: AMADEUS IT HOLDING, S.A. AND SUBSID
- Page 10 and 11: AMADEUS IT HOLDING, S.A. AND SUBSID
- Page 12 and 13: AMADEUS IT HOLDING, S.A. AND SUBSID
- Page 14 and 15: AMADEUS IT HOLDING, S.A. AND SUBSID
- Page 16 and 17: AMADEUS IT HOLDING, S.A. AND SUBSID
- Page 18 and 19: AMADEUS IT HOLDING, S.A. AND SUBSID
- Page 20 and 21: AMADEUS IT HOLDING, S.A. AND SUBSID
- Page 22 and 23: AMADEUS IT HOLDING, S.A. AND SUBSID
- Page 24 and 25: AMADEUS IT HOLDING, S.A. AND SUBSID
- Page 26 and 27: AMADEUS IT HOLDING, S.A. AND SUBSID
- Page 28 and 29: AMADEUS IT HOLDING, S.A. AND SUBSID
- Page 30 and 31: AMADEUS IT HOLDING, S.A. AND SUBSID
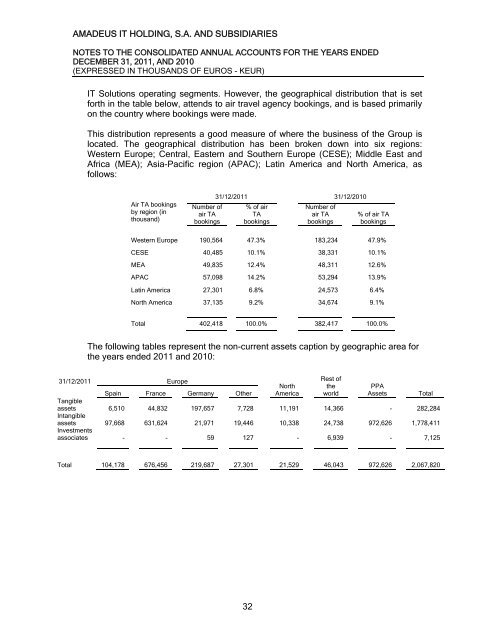
- Page 32 and 33: AMADEUS IT HOLDING, S.A. AND SUBSID
- Page 34 and 35: AMADEUS IT HOLDING, S.A. AND SUBSID
- Page 36 and 37: AMADEUS IT HOLDING, S.A. AND SUBSID
- Page 40 and 41: AMADEUS IT HOLDING, S.A. AND SUBSID
- Page 42 and 43: AMADEUS IT HOLDING, S.A. AND SUBSID
- Page 44 and 45: AMADEUS IT HOLDING, S.A. AND SUBSID
- Page 46 and 47: AMADEUS IT HOLDING, S.A. AND SUBSID
- Page 48 and 49: AMADEUS IT HOLDING, S.A. AND SUBSID
- Page 50 and 51: AMADEUS IT HOLDING, S.A. AND SUBSID
- Page 52 and 53: AMADEUS IT HOLDING, S.A. AND SUBSID
- Page 54 and 55: AMADEUS IT HOLDING, S.A. AND SUBSID
- Page 56 and 57: AMADEUS IT HOLDING, S.A. AND SUBSID
- Page 58 and 59: AMADEUS IT HOLDING, S.A. AND SUBSID
- Page 60 and 61: AMADEUS IT HOLDING, S.A. AND SUBSID
- Page 62 and 63: AMADEUS IT HOLDING, S.A. AND SUBSID
- Page 64 and 65: AMADEUS IT HOLDING, S.A. AND SUBSID
- Page 66 and 67: AMADEUS IT HOLDING, S.A. AND SUBSID
- Page 68 and 69: AMADEUS IT HOLDING, S.A. AND SUBSID
- Page 70 and 71: AMADEUS IT HOLDING, S.A. AND SUBSID
- Page 72 and 73: AMADEUS IT HOLDING, S.A. AND SUBSID
- Page 74 and 75: AMADEUS IT HOLDING, S.A. AND SUBSID
- Page 76 and 77: AMADEUS IT HOLDING, S.A. AND SUBSID
- Page 78 and 79: AMADEUS IT HOLDING, S.A. AND SUBSID
- Page 80 and 81: AMADEUS IT HOLDING, S.A. AND SUBSID
- Page 82 and 83: AMADEUS IT HOLDING, S.A. AND SUBSID
- Page 84 and 85: AMADEUS IT HOLDING, S.A. AND SUBSID
- Page 86 and 87: AMADEUS IT HOLDING, S.A. AND SUBSID
- Page 88 and 89:
AMADEUS IT HOLDING, S.A. AND SUBSID
- Page 90 and 91:
AMADEUS IT HOLDING, S.A. AND SUBSID
- Page 92 and 93:
AMADEUS IT HOLDING, S.A. AND SUBSID
- Page 94 and 95:
AMADEUS IT HOLDING, S.A. AND SUBSID
- Page 96 and 97:
AMADEUS IT HOLDING, S.A. AND SUBSID
- Page 98 and 99:
AMADEUS IT HOLDING, S.A. AND SUBSID
- Page 100 and 101:
AMADEUS IT HOLDING, S.A. AND SUBSID
- Page 102 and 103:
AMADEUS IT HOLDING, S.A. AND SUBSID
- Page 104 and 105:
AMADEUS IT HOLDING, S.A. AND SUBSID
- Page 106 and 107:
AMADEUS IT HOLDING, S.A. AND SUBSID
- Page 108 and 109:
AMADEUS IT HOLDING, S.A. AND SUBSID
- Page 110 and 111:
AMADEUS IT HOLDING, S.A. AND SUBSID
- Page 112 and 113:
AMADEUS IT HOLDING, S.A. AND SUBSID
- Page 114 and 115:
AMADEUS IT HOLDING, S.A. AND SUBSID
- Page 116 and 117:
AMADEUS IT HOLDING, S.A. AND SUBSID
- Page 118 and 119:
AMADEUS IT HOLDING, S.A. AND SUBSID
- Page 120 and 121:
AMADEUS IT HOLDING, S.A. AND SUBSID
- Page 122 and 123:
AMADEUS IT HOLDING, S.A. AND SUBSID
- Page 124 and 125:
AMADEUS IT HOLDING, S.A. AND SUBSID
- Page 126 and 127:
AMADEUS IT HOLDING, S.A. AND SUBSID
- Page 128 and 129:
AMADEUS IT HOLDING, S.A. AND SUBSID
- Page 130 and 131:
AMADEUS IT HOLDING, S.A. AND SUBSID
- Page 132 and 133:
AMADEUS IT HOLDING, S.A. AND SUBSID
- Page 134 and 135:
AMADEUS IT HOLDING, S.A. AND SUBSID
- Page 136 and 137:
AMADEUS IT HOLDING, S.A. AND SUBSID
- Page 138 and 139:
AMADEUS IT HOLDING, S.A. AND SUBSID
- Page 140 and 141:
AMADEUS IT HOLDING, S.A. AND SUBSID
- Page 142 and 143:
AMADEUS IT HOLDING, S.A. AND SUBSID
- Page 144 and 145:
AMADEUS IT HOLDING, S.A. AND SUBSID
- Page 146 and 147:
AMADEUS IT HOLDING, S.A. AND SUBSID
- Page 148 and 149:
AMADEUS IT HOLDING, S.A. AND SUBSID
- Page 150 and 151:
AMADEUS IT HOLDING, S.A. AND SUBSID
- Page 152 and 153:
AMADEUS IT HOLDING, S.A. AND SUBSID
- Page 154 and 155:
AMADEUS IT HOLDING, S.A. AND SUBSID
- Page 156 and 157:
AMADEUS IT HOLDING, S.A. AND SUBSID
- Page 158 and 159:
AMADEUS IT HOLDING, S.A. AND SUBSID
- Page 160 and 161:
AMADEUS IT HOLDING, S.A. AND SUBSID
- Page 162 and 163:
AMADEUS IT HOLDING, S.A. AND SUBSID
- Page 164 and 165:
AMADEUS IT HOLDING, S.A. AND SUBSID
- Page 166 and 167:
AMADEUS IT HOLDING, S.A. AND SUBSID
- Page 168 and 169:
AMADEUS IT HOLDING, S.A. AND SUBSID
- Page 170 and 171:
AMADEUS IT HOLDING, S.A. AND SUBSID
- Page 172 and 173:
AMADEUS IT HOLDING, S.A. AND SUBSID
- Page 174 and 175:
AMADEUS IT HOLDING, S.A. AND SUBSID
- Page 176 and 177:
FORM ANNUAL CORPORATE GOVERNANCE RE
- Page 178 and 179:
A.3 Please complete the following t
- Page 180 and 181:
A.8 Please complete the following t
- Page 182 and 183:
B.1.2 Please complete the following
- Page 184 and 185:
Central Bank to assume a role with
- Page 186 and 187:
Reasons As a result of the placemen
- Page 188 and 189:
B.1.8 Please detail any Board membe
- Page 190 and 191:
Other Benefits Amount in thousands
- Page 192 and 193:
B.1.13 Please identify the total am
- Page 194 and 195:
Please specify whether the Board at
- Page 196 and 197:
MR. ENRIQUE DUPUY DE LOME CHAVARRI
- Page 198 and 199:
B.1.19 Please specify the procedure
- Page 200 and 201:
B.1.24 Please specify whether the c
- Page 202 and 203:
Please specify, if applicable, the
- Page 204 and 205:
Outgoing auditor Incoming auditor I
- Page 206 and 207:
Explanation of procedure its books,
- Page 208 and 209:
egulatory requirements, the proper
- Page 210 and 211:
l) issue a report annually, prior t
- Page 212 and 213:
OPERATION: The Nomination and Remun
- Page 214 and 215:
C. RELATED-PARTY TRANSACTIONS C.1.
- Page 216 and 217:
- To analyze, measure and evaluate
- Page 218 and 219:
shareholders and provided that said
- Page 220 and 221:
E.6 Please provide details of any a
- Page 222 and 223:
7.- Report on the remuneration poli
- Page 224 and 225:
) Identity of grantor and represent
- Page 226 and 227:
c) Transactions whose effect is equ
- Page 228 and 229:
2. Transactions carried out at pric
- Page 230 and 231:
Complies 15. That when the number o
- Page 232 and 233:
Complies 25. Companies should organ
- Page 234 and 235:
34. That whenever, due to resignati
- Page 236 and 237:
vii) Remuneration of executive Boar
- Page 238 and 239:
50. That the Audit Committee shall
- Page 240 and 241:
It is the power of the Nomination a
- Page 242 and 243:
Section B.1.13 There are no indemni
- Page 244 and 245:
COMPLEMENTARY INFORMATION TO THE CO
- Page 246 and 247:
AMADEUS AMADEUS IT IT HOLDING, HOLD
- Page 248 and 249:
The Human Resources Unit is respons
- Page 250 and 251:
In 2011 Amadeus’ Finance Function
- Page 252 and 253:
In addition the Audit Committee has
- Page 254 and 255:
Use of estimates and assumptions, a
- Page 256 and 257:
The SLA should include next minimum
- Page 258 and 259:
The Committee supports and oversees
- Page 263 and 264:
Key terms � “ACH”: refers to