Benchmarking National - PRO INNO Europe
Benchmarking National - PRO INNO Europe
Benchmarking National - PRO INNO Europe

You also want an ePaper? Increase the reach of your titles
YUMPU automatically turns print PDFs into web optimized ePapers that Google loves.
230<br />
BENCHMARKING NATIONAL AND REGIONAL SUPPORT SERVICES FOR SMES IN THE FIELD OF INTELLECTUAL AND INDUSTRIAL <strong>PRO</strong>PERTY<br />
Characteristics of the user group<br />
In the course of the user survey, 12 private inventors and 37 users from SMEs were<br />
interviewed. The inclusion of private inventors was done in order to analyse<br />
whether it is feasible to include SMEs and private inventors in one target group and<br />
treat them both alike or, alternatively, whether both groups have different needs<br />
and perceptions of the services which should be accounted for. One hypothesis<br />
regarding private inventors in this context could be that they might be future<br />
founders of successful start-ups and therefore worthwhile to foster. On the other<br />
hand, private inventors are often associated with people working on commercially<br />
useless inventions just for the fun of inventing – in such a case extending support<br />
would be hard to argue for.<br />
Within the group of the interviewed SMEs around 98 % employ less than 9<br />
employees and are thus micro-enterprises; the remaining companies have at most<br />
10 to 49 employees. A focus of the Foundation on very small organisational sizes<br />
(even in the group of SMEs) is thus apparent.<br />
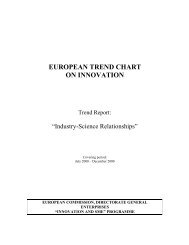
Between 2003 and 2005, 60 % of the SME users introduced product innovations<br />
(new or significantly improved products) onto the market; and around 35 % came<br />
up with process innovations. As can bee seen from Graph 126, a high number of<br />
enterprises were engaged in innovation activities across a number of mentioned<br />
categories. Around 65 % of the service users from SMEs conducted intramural<br />
R&D. On average, about 84 % of the staff works in R&D. The private inventors<br />
Graph 126 Foundation for Finnish Inventions–Innovation activities in interview<br />
sample, 2005, percentage of respondents*), SME users<br />
%<br />
100<br />
80<br />
60<br />
40<br />
20<br />
0<br />
65<br />
Intramural research<br />
& experimental<br />
development (R&D)<br />
59<br />
Acquisition of R&D<br />
(extramural R&D)<br />
54 54<br />
Acquisition of<br />
machinery and<br />
equipment<br />
*) multiple answers allowed. Source: User Survey, n = 37<br />
Training<br />
68<br />
Market introduction<br />
of innovations<br />
Graph 127 Foundation for Finnish Inventions–Usage of different service<br />
providers by SMEs, percentage of respondents*), SME users<br />
100<br />
%<br />
80<br />
60<br />
40<br />
20<br />
0<br />
46<br />
46<br />
<strong>National</strong><br />
agency<br />
51<br />
8<br />
Regional<br />
agency<br />
3 6<br />
Chamber of<br />
commerce<br />
41<br />
38<br />
Patent<br />
office<br />
*) multiple answers allowed. Source: User Survey, n = 37<br />
22<br />
14<br />
Patent<br />
attorney<br />
frequently occasionally<br />
30<br />
16<br />
External<br />
consultants<br />
51<br />
Design<br />
8<br />
3<br />
EU<br />
46<br />
Other preparations<br />
for<br />
production/deliveries<br />
23<br />
Other