Benchmarking National - PRO INNO Europe
Benchmarking National - PRO INNO Europe
Benchmarking National - PRO INNO Europe

You also want an ePaper? Increase the reach of your titles
YUMPU automatically turns print PDFs into web optimized ePapers that Google loves.
34<br />
BENCHMARKING NATIONAL AND REGIONAL SUPPORT SERVICES FOR SMES IN THE FIELD OF INTELLECTUAL AND INDUSTRIAL <strong>PRO</strong>PERTY<br />
including, among others, the route taken for applications (PCT, national, Eurodirect),<br />
the number of countries for which protection is sought, the number of<br />
pages of an application and the technology field in question.<br />
Roland Berger Market Research (Roland Berger Market Research, 2004) was given<br />
the task by the <strong>Europe</strong>an Patent Office to analyse and compare the costs of<br />
patenting in different countries. The methodology included a survey of about 250<br />
patenting companies (a mixture of SMEs and large firms) and the analysis of<br />
available data from the EPO, both from which model patents (representing<br />
“typical” patent applications) have been derived. Average costs for a Euro-direct<br />
and a Euro PCT model patent are shown in Table 2.<br />
Comparisons with the US and Japan indicate that a Euro-direct patent may be, on<br />
average, more than twice as expensive as an equivalent US patent and more than<br />
three times more expensive than a Japanese patent. High costs in <strong>Europe</strong> are said<br />
to be mostly due to translation costs, which are irrelevant for the US and Japanese<br />
patent systems. Official fees seem to play a rather minor role – they are estimated<br />
to amount to on average € 3,470 at the EPO, € 2,050 at the USPTO and € 1,570<br />
at the JPO. As these figures are estimates by the patentees, it may be assumed that<br />
they are already adjusted for preferential rates given to SMEs in the US (by using<br />
the so-called Small Entity Act) and by the JPO for initial filings.<br />
It is once again important to underline that, while the figures and model patents<br />
are based on empirical data, variations with respect to certain cost categories can<br />
amount to up to 100 %. It can be easily seen that the costs are considerable for a<br />
company.<br />
Further, it is necessary to look at the timing of the payments, i.e., when<br />
individual fee instalments are due. For the PCT route, for example, a patentee has<br />
to decide within 30 months7 after having started the patenting process (the<br />
reference point in time is called the priority date), in which countries he/she is<br />
actually looking for patent protection. This gives the firm a bit of leeway for cost<br />
and strategic planning, but it also sets a deadline. Similar periods of times and<br />
deadlines apply for other cost categories in the patenting process. Overall, the cost<br />
structure and the timing of the instalments have relatively far-reaching consequences<br />
for the design of an IPR support service (especially for financial subsidies – where<br />
aspects such as what type of costs are to be subsidised or for how much time<br />
support should be given – have to be taken into account) and for the strategic IP<br />
management of a firm.<br />
Difficult enforceability of IP rights<br />
IP rights can only work to the extent to which they are enforceable. In case a<br />
competitor infringes the IPR of a firm, the firm should be able to litigate successfully,<br />
at sufficiently low costs and in a timely manner. In practice, however, litigation<br />
often turns out to be difficult.<br />
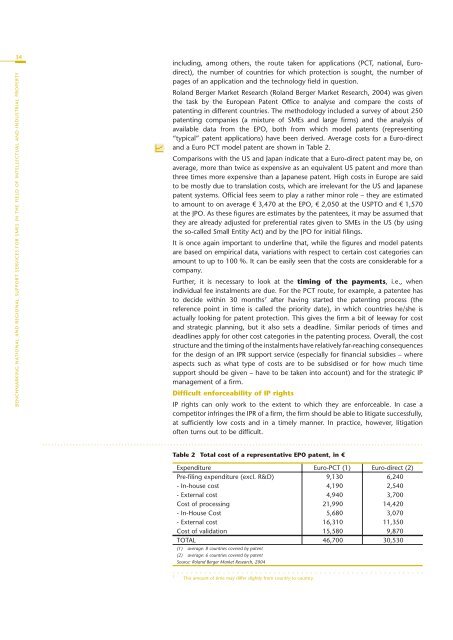
Table 2 Total cost of a representative EPO patent, in €<br />
Expenditure Euro-PCT (1) Euro-direct (2)<br />
Pre-filing expenditure (excl. R&D) 9,130 6,240<br />
- In-house cost 4,190 2,540<br />
- External cost 4,940 3,700<br />
Cost of processing 21,990 14,420<br />
- In-House Cost 5,680 3,070<br />
- External cost 16,310 11,350<br />
Cost of validation 15,580 9,870<br />
TOTAL 46,700 30,530<br />
(1) average: 8 countries covered by patent<br />
(2) average: 6 countries covered by patent<br />
Source: Roland Berger Market Research, 2004<br />
7 This amount of time may differ slightly from country to country.