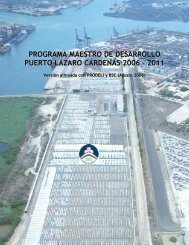
programa maestro de desarrollo puerto lázaro cárdenas 2006 â 2011
programa maestro de desarrollo puerto lázaro cárdenas 2006 â 2011
programa maestro de desarrollo puerto lázaro cárdenas 2006 â 2011

You also want an ePaper? Increase the reach of your titles
YUMPU automatically turns print PDFs into web optimized ePapers that Google loves.
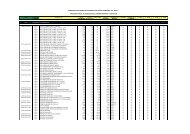
Programa Maestro <strong>de</strong> Desarrollo Portuario <strong>2006</strong> – <strong>2011</strong>. Puerto Lázaro Cár<strong>de</strong>nasCONCEPTO 2016 2017 2018 2019 2020Buques 1200 1280 1365 1459 1560INFRAESTRUCTURAPORTUARIA 327,505,067 343,326,464 367,708,874 390,711,200 415,553,697CESIÓN PARCIAL DEDERECHOS 482,767,375 455,807,766 466,413,665 475,638,484 485,154,447MANIOBRAS Y OTROS 37,023,153 38,903,299 32,678,578 25,542,628 17,364,394PRODUCTOS FINANCIEROS 7,553,400 8,044,180 8,566,700 9,103,200 9,715,900TOTAL INGRESOS 854,848,995 846,081,709 875,367,817 900,995,512 927,788,438GASTOS DE OPERACIÓN 167,740,628 184,514,691 202,966,160 223,262,776 245,589,054GASTOS DE ADMINISTRACIÓN 59,808,077 65,788,884 72,367,773 79,604,550 87,565,005OBRAS DE MANTENIMIENTO 31,693,046 33,621,940 35,676,150 37,863,790 38,193,500CONTRAPRESTACIÓN 71,711,815 78,455,033 84,092,637 91,576,872 100,198,985OBRA PUBLICA 498,000,000 470,500,000 466,000,000 454,000,000 440,000,000BINES MUEBLES E INMUEBLES 25,895,430 13,201,161 14,265,097 14,687,524 16,241,894OTROS GASTOSTOTAL COSTOS 854,848,995 846,081,709 875,367,817 900,995,512 927,788,438RESULTADO BRUTO -0 -0 -0 0 0CONCEPTO 2021 2022 2023 2024 2025Buques 1647 1747 1857 1980 2127INFRAESTRUCTURAPORTUARIA 437,175,965 461,576,480 488,470,977 518,603,741 551,726,754CESIÓN PARCIAL DEDERECHOS 494,953,753 505,069,654 515,809,184 525,097,068 535,546,313MANIOBRAS Y OTROS 18,409,731 19,517,996 20,692,980 21,938,697 23,259,407PRODUCTOS FINANCIEROS 10,347,010 11,013,160 11,734,930 12,947,250 13,309,100TOTAL INGRESOS 960,886,459 997,177,290 1,036,708,071 1,078,586,756 1,123,841,574GASTOS DE OPERACIÓN 270,147,959 297,162,755 326,879,030 359,566,934 395,523,627GASTOS DE ADMINISTRACIÓN 96,321,505 105,953,656 116,549,021 128,203,924 141,024,316OBRAS DE MANTENIMIENTO 40,674,653 43,316,940 45,130,850 47,127,570 49,318,960CONTRAPRESTACIÓN 109,589,722 120,463,656 131,624,912 144,548,371 158,313,099OBRA PUBLICA 418,000,000 392,000,000 381,000,000 371,000,000 368,000,000BINES MUEBLES E INMUEBLES 26,152,620 38,280,284 35,524,257 28,139,958 11,661,572OTROS GASTOSTOTAL COSTOS 960,886,459 997,177,291 1,036,708,071 1,078,586,756 1,123,841,574RESULTADO BRUTO -0 -0 -0 0 0105