- Page 2 and 3:
Foto portada:Casa de máquinas cent
- Page 5:
ContenidoInforme de gestión de la
- Page 8 and 9:
Con el propósito de conservar una
- Page 10 and 11:
La capacidad de generación, sumada
- Page 12 and 13:
Este año se continuarán los trám
- Page 14 and 15:
nas de influencia de los activos de
- Page 16:
gestión de Celsia. Esta forma de p
- Page 27 and 28:
Reporte Integrado Celsia-Nuestro ne
- Page 29:
2018
- Page 35:
Reporte Integrado Celsia-Nuestro ne
- Page 38:
En 2012, Celsia realizó un ejercic
- Page 48:
Gobierno corporativoMarco de gobier
- Page 52 and 53:
GESTIÓNDEL RIESGO
- Page 57:
Reporte Integrado Celsia-Gestión d
- Page 62:
Hacia dónde vamosLa Organización
- Page 73 and 74:
Reporte Integrado Celsia-Desempeño
- Page 75 and 76:
Reporte Integrado Celsia-Desempeño
- Page 77 and 78:
Reporte Integrado Celsia-Desempeño
- Page 80:
Gestión ambientalLa Organización
- Page 83 and 84:
Reporte Integrado Celsia-Desempeño
- Page 85:
Reporte Integrado Celsia-Desempeño
- Page 93:
Reporte Integrado Celsia-Desempeño
- Page 98 and 99:
Evaluaciones de desempeñoy desarro
- Page 101:
Reporte Integrado Celsia-Desempeño
- Page 104:
Fundaciones Celsia y EPSALas línea
- Page 112 and 113:
Reporte Integrado Celsia-Estados Fi
- Page 114 and 115:
Reporte Integrado Celsia-Estados Fi
- Page 116 and 117:
Reporte Integrado Celsia-Estados Fi
- Page 118 and 119:
Reporte Integrado Celsia-Estados Fi
- Page 120 and 121:
Reporte Integrado Celsia-Estados Fi
- Page 122 and 123:
Reporte Integrado Celsia-Estados Fi
- Page 124 and 125:
Reporte Integrado Celsia-Estados Fi
- Page 126 and 127:
Reporte Integrado Celsia-Estados Fi
- Page 128 and 129:
Reporte Integrado Celsia-Estados Fi
- Page 130 and 131:
Reporte Integrado Celsia-Estados Fi
- Page 132 and 133:
Reporte Integrado Celsia-Estados Fi
- Page 134 and 135:
Reporte Integrado Celsia-Estados Fi
- Page 136 and 137:
Reporte Integrado Celsia-Estados Fi
- Page 138 and 139:
Reporte Integrado Celsia-Estados Fi
- Page 140 and 141:
Reporte Integrado Celsia-Estados Fi
- Page 143 and 144:
2011Fecha devalorValorizaciónMéto
- Page 145 and 146:
Productora de Carbón de Occidente
- Page 147 and 148:
NOTA 10 - Propiedades, planta y equ
- Page 149 and 150: La compañía y sus controladas pos
- Page 151 and 152: Como se indica en la Nota 1, el 23
- Page 153 and 154: El detalle de las obligaciones fina
- Page 155 and 156: El detalle de las obligaciones fina
- Page 157 and 158: (2) Al 31 de diciembre de 2011, la
- Page 159 and 160: Reforma tributariaA continuación s
- Page 161 and 162: La determinación del impuesto de r
- Page 163 and 164: El saldo de pensiones se muestra a
- Page 165 and 166: Responsabilidades contingentesGaran
- Page 167 and 168: (2) Corresponde a ventas de energí
- Page 169 and 170: (2) Los honorarios incluyen los sig
- Page 171 and 172: NOTA 29 - Gastos no operacionalesLo
- Page 173 and 174: el municipio de Dagua liquidó acta
- Page 175 and 176: Información suplementariaCelsia S.
- Page 177 and 178: LiquidezCapital de trabajoRazón co
- Page 180 and 181: o que mis auditorías me proporcion
- Page 182 and 183: Celsia S.A. E.S.P.Balance GeneralAl
- Page 184 and 185: Celsia S.A. E.S.P.Estado de Cambios
- Page 186 and 187: Celsia S.A. E.S.P.Estado de Flujos
- Page 188 and 189: Con el propósito de desarrollar di
- Page 190 and 191: SSPD - 20051300033635 del 28 de dic
- Page 192 and 193: Una vez registrado el método de pa
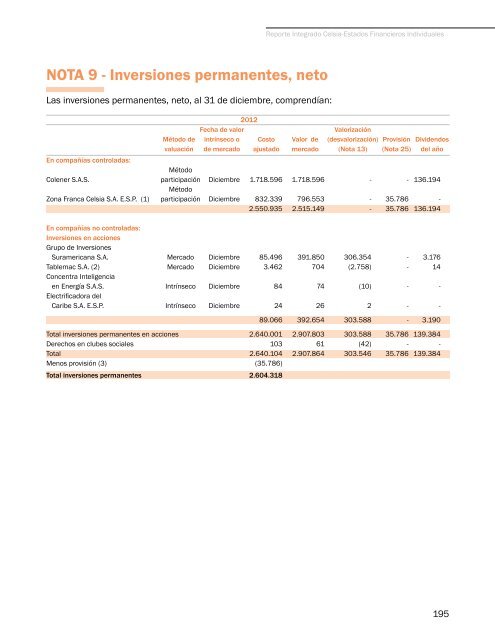
- Page 194 and 195: un pronunciamiento justo y equitati
- Page 196 and 197: Estimaciones contablesEn la prepara
- Page 198 and 199: NOTA 6 - Inversiones temporalesLas
- Page 202 and 203: 2011Fecha de valorValorizaciónMét
- Page 204 and 205: Como resultado de la aplicación de
- Page 206 and 207: Zona Franca Celsia S.A. E.S.P. (ant
- Page 208 and 209: Durante 2012 y 2011, se realizaron
- Page 210 and 211: NOTA 13 - Valorizaciones y desvalor
- Page 212 and 213: En el periodo se cargaron a los res
- Page 214 and 215: años 2013 y siguientes, introducid
- Page 216 and 217: La conciliación entre el patrimoni
- Page 218 and 219: De acuerdo con lo establecido en la
- Page 220 and 221: NOTA 21 - Costo de ventasEl costo d
- Page 222 and 223: (2) Los honorarios incluyen los sig
- Page 224 and 225: NOTA 24 - Gastos financierosLos gas
- Page 226 and 227: 3. Servicios o asesorías sin costo
- Page 228 and 229: Indicadores financieros2012 2011Liq
- Page 230 and 231: TABLAINDICADORESGRI224
- Page 232 and 233: GRI Descripción indicador Respuest
- Page 234 and 235: 238
- Page 236 and 237: RECONOCIMIENTOS
- Page 238: Certificaciones en sistemas de gest
- Page 241: www.celsia.comVigilada por la Super