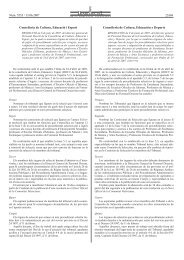
EVOLUCIÓN DEL MERCADO DE TRABAJO ESPAÑOL EN EL…CUADRO 3Tasas <strong>de</strong> Empleo y paro por sexo y edad, 1997-2007(% pob<strong>la</strong>ción total y % pob<strong>la</strong>ción activa <strong>en</strong> cada grupo <strong>de</strong> edad y sexo, segundos trimestres)Sexo y edadTasa <strong>de</strong> empleoTasa <strong>de</strong> paro1997 2007 1997 2007VaronesTotal 54,5 65,1 16,1 6,1De 16 a 19 años 14,5 27,2 44,9 24,3De 20 a 24 años 43,1 62,8 30,2 12,2De 25 a 54 años 79,8 88,1 13,9 5,1De 55 y más años 23,1 27,3 10,3 4,6MujeresTotal 27,9 43,7 28,0 10,5De 16 a 19 años 8,5 15,4 59,2 36,7De 20 a 24 años 31,9 50,5 42,0 18,3De 25 a 54 años 43,9 65,8 25,4 9,2De 55 y más años 7,2 11,8 12,4 6,9Ambos sexosTotal 40,8 54,2 20,7 8,0De 16 a 19 años 11,6 21,5 51,0 29,1De 20 a 24 años 37,6 56,8 35,6 14,9De 25 a 54 años 61,9 77,1 18,3 6,9De 55 y más años 14,3 18,8 10,9 5,4Fu<strong>en</strong>te: INE, Encuesta <strong>de</strong> Pob<strong>la</strong>ción Activa [www.ine.es/inebase].extremo, <strong>la</strong>s tasas <strong>de</strong> Extremadura, Andalucía yAsturias no llegaban al 60 por 100. De igual forma,<strong>la</strong> tasa <strong>de</strong> paro más alta todavía supera <strong>en</strong> 2,5veces (<strong>en</strong> un 246 por 100) a <strong>la</strong> más baja <strong>en</strong> <strong>el</strong> segundotrimestre <strong>de</strong> 2007.Persiste también una baja movilidad que contribuyea mant<strong>en</strong>er esas distancias. Según <strong>el</strong> Eurobarómetro <strong>sobre</strong> movilidad geográfica realizadopor <strong>la</strong> Comisión Europea <strong>en</strong> septiembre <strong>de</strong> 2005,sólo un 11 por 100 <strong>de</strong> <strong>la</strong> pob<strong>la</strong>ción <strong>en</strong> España <strong>de</strong>c<strong>la</strong>rahaberse movido <strong>en</strong>tre regiones <strong>de</strong> su mismopaís, siete puntos m<strong>en</strong>os que <strong>la</strong> media <strong>de</strong> <strong>la</strong> UE-25.Sobre <strong>la</strong>s difer<strong>en</strong>cias <strong>en</strong> empleo y paro másacusadas cuando se ati<strong>en</strong><strong>de</strong> a los grupos básicos<strong>de</strong> pob<strong>la</strong>ción, es obligado subrayar <strong>la</strong> persist<strong>en</strong>cia<strong>de</strong> tasas <strong>de</strong> empleo más bajas y tasas <strong>de</strong> paro másaltas <strong>en</strong>tre <strong>la</strong>s mujeres y <strong>en</strong>tre los jóv<strong>en</strong>es.A pesar d<strong>el</strong> indudable mayor dinamismo <strong>de</strong> <strong>la</strong>creación <strong>de</strong> empleo <strong>en</strong> <strong>el</strong> sexo fem<strong>en</strong>ino a lo <strong>la</strong>rgo<strong>de</strong> todo <strong>el</strong> último <strong>de</strong>c<strong>en</strong>io, cabe recordar qu<strong>el</strong>a tasa <strong>de</strong> empleo <strong>de</strong> <strong>la</strong>s mujeres se sitúa todavíamuy por <strong>de</strong>bajo <strong>de</strong> <strong>la</strong> correspondi<strong>en</strong>te a los varonesy permanece <strong>en</strong>tre <strong>la</strong>s más bajas <strong>de</strong> toda <strong>la</strong>UE-25. En <strong>el</strong> segundo trimestre <strong>de</strong> 2007, <strong>la</strong> tasa <strong>de</strong>empleo fem<strong>en</strong>ina <strong>en</strong>tre 25 y 54 años, que es <strong>el</strong> grupo<strong>de</strong> edad don<strong>de</strong> se conc<strong>en</strong>tra <strong>la</strong> actividad <strong>la</strong>boral<strong>de</strong> <strong>la</strong>s mujeres, era ya d<strong>el</strong> 65,8 por 100, más <strong>de</strong>20 puntos superior a <strong>la</strong> que se recogía diez añosatrás (43,9 por 100 <strong>en</strong> <strong>el</strong> mismo trimestre <strong>de</strong> 1997).A su vez, <strong>el</strong> <strong>de</strong>sempleo fem<strong>en</strong>ino, aunque ha <strong>de</strong>sc<strong>en</strong>didomás rápidam<strong>en</strong>te que <strong>el</strong> masculino, siguesi<strong>en</strong>do mucho más alto: 10,5 fr<strong>en</strong>te a 6,1 por 100<strong>en</strong> <strong>el</strong> segundo trimestre d<strong>el</strong> año 2007. En cuantoa los jóv<strong>en</strong>es, los <strong>de</strong> 20 a 24 años <strong>de</strong> edad (don<strong>de</strong>ya es alta <strong>la</strong> participación <strong>en</strong> <strong>el</strong> mercado <strong>de</strong> trabajo)pres<strong>en</strong>taban <strong>en</strong> ese mismo trimestre una tasa<strong>de</strong> empleo d<strong>el</strong> 56,8 por 100, 2,5 puntos más qu<strong>el</strong>a correspondi<strong>en</strong>te al total <strong>de</strong> eda<strong>de</strong>s, pero su tasa<strong>de</strong> paro era d<strong>el</strong> 14,9 por 100, casi 7 puntos por <strong>en</strong>cima<strong>de</strong> <strong>la</strong> g<strong>en</strong>eral. Es verdad que hace diez años<strong>la</strong>s difer<strong>en</strong>cias <strong>en</strong> empleo eran <strong>de</strong>sfavorables paraeste grupo, pero <strong>la</strong>s tasas <strong>de</strong> paro, <strong>en</strong> distancia,son más <strong>de</strong>sfavorables a los jóv<strong>en</strong>es ahora quehace 10 años: cuando <strong>el</strong> paro era “uniformem<strong>en</strong>te<strong>el</strong>evado” (cuadro 3).A<strong>de</strong>más <strong>de</strong> esas difer<strong>en</strong>cias, <strong>la</strong> pres<strong>en</strong>cia creci<strong>en</strong>te<strong>de</strong> pob<strong>la</strong>ción activa extranjera <strong>en</strong> <strong>el</strong> mercado<strong>de</strong> trabajo español ha hecho surgir, <strong>en</strong> los últimosaños, nuevos perfiles personales <strong>en</strong> <strong>el</strong> empleoy <strong>en</strong> <strong>el</strong> paro. Por una parte, ha impulsado <strong>el</strong> creci-31
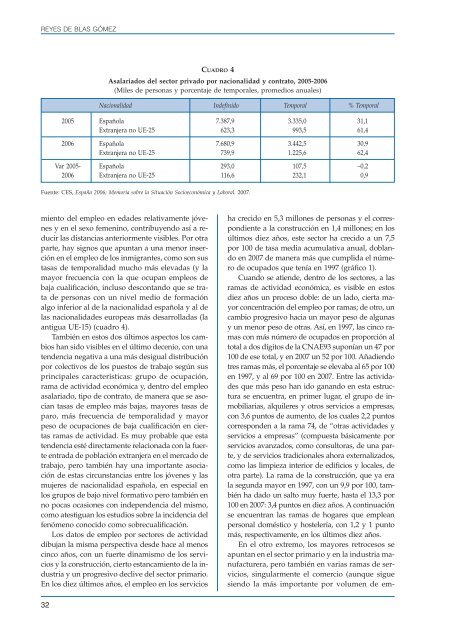
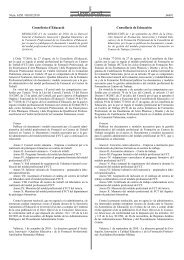
REYES DE BLAS GÓMEZCUADRO 4Asa<strong>la</strong>riados d<strong>el</strong> sector privado por nacionalidad y contrato, 2005-2006(Miles <strong>de</strong> personas y porc<strong>en</strong>taje <strong>de</strong> temporales, promedios anuales)Nacionalidad In<strong>de</strong>finido Temporal % Temporal2005 Españo<strong>la</strong> 7.387,9 3.335,0 31,1Extranjera no UE-25 623,3 993,5 61,42006 Españo<strong>la</strong> 7.680,9 3.442,5 30,9Extranjera no UE-25 739,9 1.225,6 62,4Var 2005- Españo<strong>la</strong> 293,0 107,5 –0,22006 Extranjera no UE-25 116,6 232,1 0,9Fu<strong>en</strong>te: CES, España 2006; Memoria <strong>sobre</strong> <strong>la</strong> Situación Socioeconómica y Laboral. 2007.mi<strong>en</strong>to d<strong>el</strong> empleo <strong>en</strong> eda<strong>de</strong>s r<strong>el</strong>ativam<strong>en</strong>te jóv<strong>en</strong>esy <strong>en</strong> <strong>el</strong> sexo fem<strong>en</strong>ino, contribuy<strong>en</strong>do así a reducir<strong>la</strong>s distancias anteriorm<strong>en</strong>te visibles. Por otraparte, hay signos que apuntan a una m<strong>en</strong>or inserción<strong>en</strong> <strong>el</strong> empleo <strong>de</strong> los inmigrantes, como son sustasas <strong>de</strong> temporalidad mucho más <strong>el</strong>evadas (y <strong>la</strong>mayor frecu<strong>en</strong>cia con <strong>la</strong> que ocupan empleos <strong>de</strong>baja cualificación, incluso <strong>de</strong>scontando que se trata<strong>de</strong> personas con un niv<strong>el</strong> medio <strong>de</strong> formaciónalgo inferior al <strong>de</strong> <strong>la</strong> nacionalidad españo<strong>la</strong> y al d<strong>el</strong>as nacionalida<strong>de</strong>s europeas más <strong>de</strong>sarrol<strong>la</strong>das (<strong>la</strong>antigua UE-15) (cuadro 4).También <strong>en</strong> estos dos últimos aspectos los cambioshan sido visibles <strong>en</strong> <strong>el</strong> último <strong>de</strong>c<strong>en</strong>io, con unat<strong>en</strong><strong>de</strong>ncia negativa a una más <strong>de</strong>sigual distribuciónpor colectivos <strong>de</strong> los puestos <strong>de</strong> trabajo según susprincipales características: grupo <strong>de</strong> ocupación,rama <strong>de</strong> actividad económica y, <strong>de</strong>ntro d<strong>el</strong> empleoasa<strong>la</strong>riado, tipo <strong>de</strong> contrato, <strong>de</strong> manera que se asociantasas <strong>de</strong> empleo más bajas, mayores tasas <strong>de</strong>paro, más frecu<strong>en</strong>cia <strong>de</strong> temporalidad y mayorpeso <strong>de</strong> ocupaciones <strong>de</strong> baja cualificación <strong>en</strong> ciertasramas <strong>de</strong> actividad. Es muy probable que estat<strong>en</strong><strong>de</strong>ncia esté directam<strong>en</strong>te r<strong>el</strong>acionada con <strong>la</strong> fuerte<strong>en</strong>trada <strong>de</strong> pob<strong>la</strong>ción extranjera <strong>en</strong> <strong>el</strong> mercado <strong>de</strong>trabajo, pero también hay una importante asociación<strong>de</strong> estas circunstancias <strong>en</strong>tre los jóv<strong>en</strong>es y <strong>la</strong>smujeres <strong>de</strong> nacionalidad españo<strong>la</strong>, <strong>en</strong> especial <strong>en</strong>los grupos <strong>de</strong> bajo niv<strong>el</strong> formativo pero también <strong>en</strong>no pocas ocasiones con in<strong>de</strong>p<strong>en</strong><strong>de</strong>ncia d<strong>el</strong> mismo,como atestiguan los estudios <strong>sobre</strong> <strong>la</strong> inci<strong>de</strong>ncia d<strong>el</strong>f<strong>en</strong>óm<strong>en</strong>o conocido como <strong>sobre</strong>cualificación.Los datos <strong>de</strong> empleo por sectores <strong>de</strong> actividaddibujan <strong>la</strong> misma perspectiva <strong>de</strong>s<strong>de</strong> hace al m<strong>en</strong>oscinco años, con un fuerte dinamismo <strong>de</strong> los serviciosy <strong>la</strong> construcción, cierto estancami<strong>en</strong>to <strong>de</strong> <strong>la</strong> industriay un progresivo <strong>de</strong>clive d<strong>el</strong> sector primario.En los diez últimos años, <strong>el</strong> empleo <strong>en</strong> los serviciosha crecido <strong>en</strong> 5,3 millones <strong>de</strong> personas y <strong>el</strong> correspondi<strong>en</strong>tea <strong>la</strong> construcción <strong>en</strong> 1,4 millones; <strong>en</strong> losúltimos diez años, este sector ha crecido a un 7,5por 100 <strong>de</strong> tasa media acumu<strong>la</strong>tiva anual, dob<strong>la</strong>ndo<strong>en</strong> 2007 <strong>de</strong> manera más que cumplida <strong>el</strong> número<strong>de</strong> ocupados que t<strong>en</strong>ía <strong>en</strong> 1997 (gráfico 1).Cuando se ati<strong>en</strong><strong>de</strong>, <strong>de</strong>ntro <strong>de</strong> los sectores, a <strong>la</strong>sramas <strong>de</strong> actividad económica, es visible <strong>en</strong> estosdiez años un proceso doble: <strong>de</strong> un <strong>la</strong>do, cierta mayorconc<strong>en</strong>tración d<strong>el</strong> empleo por ramas; <strong>de</strong> otro, uncambio progresivo hacia un mayor peso <strong>de</strong> algunasy un m<strong>en</strong>or peso <strong>de</strong> otras. Así, <strong>en</strong> 1997, <strong>la</strong>s cinco ramascon más número <strong>de</strong> ocupados <strong>en</strong> proporción altotal a dos dígitos <strong>de</strong> <strong>la</strong> CNAE93 suponían un 47 por100 <strong>de</strong> ese total, y <strong>en</strong> 2007 un 52 por 100. Añadi<strong>en</strong>dotres ramas más, <strong>el</strong> porc<strong>en</strong>taje se <strong>el</strong>evaba al 65 por 100<strong>en</strong> 1997, y al 69 por 100 <strong>en</strong> 2007. Entre <strong>la</strong>s activida<strong>de</strong>sque más peso han ido ganando <strong>en</strong> esta estructurase <strong>en</strong>cu<strong>en</strong>tra, <strong>en</strong> primer lugar, <strong>el</strong> grupo <strong>de</strong> inmobiliarias,alquileres y otros servicios a empresas,con 3,6 puntos <strong>de</strong> aum<strong>en</strong>to, <strong>de</strong> los cuales 2,2 puntoscorrespon<strong>de</strong>n a <strong>la</strong> rama 74, <strong>de</strong> “otras activida<strong>de</strong>s yservicios a empresas” (compuesta básicam<strong>en</strong>te porservicios avanzados, como consultoras, <strong>de</strong> una parte,y <strong>de</strong> servicios tradicionales ahora externalizados,como <strong>la</strong>s limpieza interior <strong>de</strong> edificios y locales, <strong>de</strong>otra parte). La rama <strong>de</strong> <strong>la</strong> construcción, que ya era<strong>la</strong> segunda mayor <strong>en</strong> 1997, con un 9,9 por 100, tambiénha dado un salto muy fuerte, hasta <strong>el</strong> 13,3 por100 <strong>en</strong> 2007: 3,4 puntos <strong>en</strong> diez años. A continuaciónse <strong>en</strong>cu<strong>en</strong>tran <strong>la</strong>s ramas <strong>de</strong> hogares que empleanpersonal doméstico y host<strong>el</strong>ería, con 1,2 y 1 puntomás, respectivam<strong>en</strong>te, <strong>en</strong> los últimos diez años.En <strong>el</strong> otro extremo, los mayores retrocesos seapuntan <strong>en</strong> <strong>el</strong> sector primario y <strong>en</strong> <strong>la</strong> industria manufacturera,pero también <strong>en</strong> varias ramas <strong>de</strong> servicios,singu<strong>la</strong>rm<strong>en</strong>te <strong>el</strong> comercio (aunque siguesi<strong>en</strong>do <strong>la</strong> más importante por volum<strong>en</strong> <strong>de</strong> em-32
- Page 1 and 2: Informe sobre el estado deLA SEGURI
- Page 3 and 4: Primera edición: abril 2009© INSH
- Page 6: Informe sobre el estado de la segur
- Page 9 and 10: MANUEL CARLOS PALOMEQUEce inclusive
- Page 12: PresentaciónCONCEPCIÓN PASCUAL LI
- Page 16 and 17: Resumen ejecutivoEvolución del mer
- Page 18 and 19: RESUMEN EJECUTIVOla agricultura, do
- Page 20 and 21: RESUMEN EJECUTIVOzo que pretende do
- Page 22: RESUMEN EJECUTIVOtamente por la Adm
- Page 25 and 26: INFORME ANUAL 2007mente los temas q
- Page 28 and 29: 1. Evolución del mercado de trabaj
- Page 32 and 33: EVOLUCIÓN DEL MERCADO DE TRABAJO E
- Page 34 and 35: EVOLUCIÓN DEL MERCADO DE TRABAJO E
- Page 36 and 37: EVOLUCIÓN DEL MERCADO DE TRABAJO E
- Page 38 and 39: 2. Condiciones de trabajoANTONIA AL
- Page 40 and 41: CONDICIONES DE TRABAJOGRÁFICO 1Con
- Page 42 and 43: CONDICIONES DE TRABAJOTABLA 3Vibrac
- Page 44 and 45: CONDICIONES DE TRABAJOGRÁFICO 3Dem
- Page 46 and 47: CONDICIONES DE TRABAJOTABLA 5Exigen
- Page 48 and 49: CONDICIONES DE TRABAJODatos en %TAB
- Page 50 and 51: CONDICIONES DE TRABAJOGRÁFICO 6Gru
- Page 52 and 53: CONDICIONES DE TRABAJOGRÁFICO 9Gru
- Page 54 and 55: 3. Daños a la saludM.ª VICTORIA D
- Page 56 and 57: DAÑOS A LA SALUDEn la tabla 1 se r
- Page 58 and 59: DAÑOS A LA SALUDFIGURA 4Accidentes
- Page 60 and 61: DAÑOS A LA SALUDTABLA 3Accidentes
- Page 62 and 63: DAÑOS A LA SALUDTABLA 5Accidentes
- Page 64 and 65: DAÑOS A LA SALUDFIGURA 8Accidentes
- Page 66 and 67: DAÑOS A LA SALUDFIGURA 10Accidente
- Page 68 and 69: DAÑOS A LA SALUDTABLA 6Accidentes
- Page 70 and 71: DAÑOS A LA SALUDTABLA 8Accidentes
- Page 72 and 73: DAÑOS A LA SALUDFIGURA 14Evolució
- Page 74 and 75: DAÑOS A LA SALUDTABLA12Índice de
- Page 76: DAÑOS A LA SALUD3.10. FUENTES CONS
- Page 79 and 80: MIRIAM CORRALES ARIASmento general
- Page 81 and 82:
MIRIAM CORRALES ARIASestablecimient
- Page 83 and 84:
MIRIAM CORRALES ARIASpermanentes de
- Page 85 and 86:
MIRIAM CORRALES ARIASdel Parlamento
- Page 87 and 88:
MIRIAM CORRALES ARIASFinaliza el Re
- Page 89 and 90:
ADRIÁN GONZÁLEZ MARTÍNcuenta lo
- Page 91 and 92:
ADRIÁN GONZÁLEZ MARTÍNmación e
- Page 93 and 94:
ADRIÁN GONZÁLEZ MARTÍNEn cuanto
- Page 95 and 96:
ADRIÁN GONZÁLEZ MARTÍNridad en b
- Page 97 and 98:
ADRIÁN GONZÁLEZ MARTÍNMedidas de
- Page 99 and 100:
ADRIÁN GONZÁLEZ MARTÍNcomprobar
- Page 101 and 102:
ADRIÁN GONZÁLEZ MARTÍNdel proyec
- Page 103 and 104:
ADRIÁN GONZÁLEZ MARTÍNMEDIDAS AD
- Page 105 and 106:
ADRIÁN GONZÁLEZ MARTÍNcomo se de
- Page 107 and 108:
ADRIÁN GONZÁLEZ MARTÍNSe indica
- Page 109 and 110:
ADRIÁN GONZÁLEZ MARTÍNCUADRO N.
- Page 111 and 112:
ADRIÁN GONZÁLEZ MARTÍNCUADRO N.
- Page 113 and 114:
ADRIÁN GONZÁLEZ MARTÍNCUADRO N.
- Page 115 and 116:
ADRIÁN GONZÁLEZ MARTÍNCUADRO N.
- Page 117 and 118:
ADRIÁN GONZÁLEZ MARTÍNCUADRO N.
- Page 119 and 120:
CRISTINA CUENCA SÁNCHEZ DE CASTROS
- Page 121 and 122:
CRISTINA CUENCA SÁNCHEZ DE CASTROC
- Page 123 and 124:
CRISTINA CUENCA SÁNCHEZ DE CASTRO
- Page 126 and 127:
6. Acciones de promoción (cont.)T.
- Page 128 and 129:
ACCIONES DE PROMOCIÓN DE LA SEGURI
- Page 130 and 131:
ACCIONES DE PROMOCIÓN DE LA SEGURI
- Page 132 and 133:
ACCIONES DE PROMOCIÓN DE LA SEGURI
- Page 134 and 135:
ACCIONES DE PROMOCIÓN DE LA SEGURI
- Page 136:
ACCIONES DE PROMOCIÓN DE LA SEGURI
- Page 139 and 140:
JOSÉ YANES COLOMA• Aprobar la ne
- Page 141 and 142:
JOSÉ YANES COLOMAlizado los indica
- Page 143 and 144:
JOSÉ YANES COLOMA• Al análisis
- Page 145 and 146:
JOSÉ YANES COLOMAREUNIONES CELEBRA
- Page 147 and 148:
JOSÉ YANES COLOMAREUNIONES CELEBRA
- Page 150:
SEGUNDA PARTE:HACIA UN SISTEMA NACI
- Page 153 and 154:
JOSÉ LUIS CASTELLÁ LÓPEZ- Comple
- Page 155 and 156:
JOSÉ LUIS CASTELLÁ LÓPEZsobre la
- Page 157 and 158:
JOSÉ LUIS CASTELLÁ LÓPEZ1.3.2. E
- Page 159 and 160:
JOSÉ LUIS CASTELLÁ LÓPEZque sign
- Page 161 and 162:
RAFAEL ANTONIO LÓPEZ PARADAincluye
- Page 163 and 164:
RAFAEL ANTONIO LÓPEZ PARADAun sist
- Page 165 and 166:
RAFAEL ANTONIO LÓPEZ PARADAreprese
- Page 167 and 168:
RAFAEL ANTONIO LÓPEZ PARADAEn cual
- Page 169 and 170:
RAFAEL ANTONIO LÓPEZ PARADAbilitad
- Page 171 and 172:
RAFAEL ANTONIO LÓPEZ PARADAabril d
- Page 173 and 174:
RAFAEL ANTONIO LÓPEZ PARADAmente l
- Page 175 and 176:
RAFAEL ANTONIO LÓPEZ PARADA22Vid.
- Page 177 and 178:
RAFAEL ANTONIO LÓPEZ PARADAEl Cód
- Page 179 and 180:
MIGUEL ÁNGEL SÁNCHEZ DE LA ARENA3
- Page 181 and 182:
MIGUEL ÁNGEL SÁNCHEZ DE LA ARENAL
- Page 183 and 184:
MIGUEL ÁNGEL SÁNCHEZ DE LA ARENA3
- Page 185 and 186:
MIGUEL ÁNGEL SÁNCHEZ DE LA ARENAb
- Page 187 and 188:
MIGUEL ÁNGEL SÁNCHEZ DE LA ARENAp
- Page 189 and 190:
MIGUEL ÁNGEL SÁNCHEZ DE LA ARENAm
- Page 191 and 192:
MIGUEL ÁNGEL SÁNCHEZ DE LA ARENA-
- Page 194 and 195:
4. Sistema de inspecciónADRIÁN GO
- Page 196 and 197:
SISTEMA DE INSPECCIÓNComisión con
- Page 198 and 199:
SISTEMA DE INSPECCIÓNpuestos de tr
- Page 200 and 201:
5. Sistema de promoción y apoyoCAR
- Page 202 and 203:
SISTEMA DE PROMOCIÓN Y APOYOprofes
- Page 204 and 205:
SISTEMA DE PROMOCIÓN Y APOYOel mis
- Page 206 and 207:
SISTEMA DE PROMOCIÓN Y APOYOempres
- Page 208 and 209:
6. Sistema de Educación y Formaci
- Page 210 and 211:
SISTEMA DE EDUCACIÓN Y FORMACIÓNd
- Page 212 and 213:
SISTEMA DE EDUCACIÓN Y FORMACIÓNM
- Page 214 and 215:
SISTEMA DE EDUCACIÓN Y FORMACIÓNT
- Page 216 and 217:
SISTEMA DE EDUCACIÓN Y FORMACIÓNT
- Page 218 and 219:
SISTEMA DE EDUCACIÓN Y FORMACIÓNc
- Page 220 and 221:
SISTEMA DE EDUCACIÓN Y FORMACIÓN6
- Page 222:
SISTEMA DE EDUCACIÓN Y FORMACIÓN
- Page 225 and 226:
EMILIO CASTEJÓN VILELLAservicios p
- Page 227 and 228:
EMILIO CASTEJÓN VILELLASocial. Los
- Page 229 and 230:
EMILIO CASTEJÓN VILELLAEl artícul
- Page 232 and 233:
8. Sistema de informaciónFERNANDO
- Page 234 and 235:
SISTEMA DE INFORMACIÓNde los indic
- Page 236 and 237:
SISTEMA DE INFORMACIÓNpresas dadas
- Page 238:
SISTEMA DE INFORMACIÓNsiones para
- Page 241 and 242:
JERÓNIMO MAQUEDA BLASCOFIGURA 1Est
- Page 243 and 244:
JERÓNIMO MAQUEDA BLASCOTABLA 2Proy
- Page 245 and 246:
JERÓNIMO MAQUEDA BLASCOFIGURA 3Com
- Page 247 and 248:
JERÓNIMO MAQUEDA BLASCOrespectivam
- Page 249 and 250:
FRANCISCO GONZÁLEZ DE LENAAlguna d
- Page 251 and 252:
FRANCISCO GONZÁLEZ DE LENACUADRO 1
- Page 253 and 254:
FRANCISCO GONZÁLEZ DE LENA10.1.3.2
- Page 255 and 256:
FRANCISCO GONZÁLEZ DE LENAtablecer
- Page 257 and 258:
FRANCISCO GONZÁLEZ DE LENAde fórm