SALUD EN SUDAMÉRICA, <strong>2012</strong>Exclusión socialExist<strong>en</strong> distintos tipos de factores que contribuy<strong>en</strong> a laexclusión de las personas de los b<strong>en</strong>eficios del mercadoproductivo y de la red social. Estos factores se ti<strong>en</strong>d<strong>en</strong>a conc<strong>en</strong>trar <strong>en</strong> personas con mayor privaciónsocioeconómica, pobreza y falta de inserción <strong>en</strong> la redsocial.En la percepción de las personas, hay una serie decosas que consideran de gran importancia t<strong>en</strong>er paras<strong>en</strong>tirse parte de la sociedad (figura 2.7) (6). Dos terciosde personas le da primera importancia a t<strong>en</strong>er un oficioo profesión (67,7%) y la mitad da importancia a t<strong>en</strong>eringreso propio (52,0%). La t<strong>en</strong><strong>en</strong>cia de casa, tierra opropiedad y la educación superior son tambiénaltam<strong>en</strong>te consideradas (39,1% y 38,3%respectivam<strong>en</strong>te).La percepción de la importancia de no t<strong>en</strong>erdiscapacidad alcanza a casi un tercio (31,4%) y es unfactor que ti<strong>en</strong>e implicancias para <strong>salud</strong> (prev<strong>en</strong>ción,curación, rehabilitación, promoción de estilos de vida<strong>salud</strong>able). La expectativa de vivir <strong>en</strong> una ciudadgrande es un factor que motiva migraciones, conimplicancias económicas, sociales y <strong>en</strong> <strong>salud</strong>.Protección socialLa protección social incluye mecanismos, programas ysubsidios ori<strong>en</strong>tados a prev<strong>en</strong>ir o aliviar que lasposibles car<strong>en</strong>cias de condiciones o adversidades devida puedan producir necesidades, sufrimi<strong>en</strong>tos ycomplicaciones <strong>en</strong> el bi<strong>en</strong>estar de los diversos gruposde población y que no pued<strong>en</strong> abordar <strong>en</strong> formaautónoma, <strong>en</strong> temas como ingreso, vivi<strong>en</strong>da, educación,<strong>salud</strong> y otros aspectos críticos. Parte de la protecciónsocial es dada por el Estado y otra por diversas<strong>en</strong>tidades basadas <strong>en</strong> contribuciones.Desde el año 2000, el gasto público social <strong>en</strong>seguridad y asist<strong>en</strong>cia social ha aum<strong>en</strong>tadoprogresivam<strong>en</strong>te <strong>en</strong> Sudamérica. En el período 2008-2009 el gasto alcanzó aproximadam<strong>en</strong>te a 542 USdólares per cápita (de 2005) <strong>en</strong> Sudamérica. Mi<strong>en</strong>trasese gasto llegó a 719 y 711 dólares per cápita <strong>en</strong>Uruguay y Brasil respectivam<strong>en</strong>te, <strong>en</strong> Ecuador yParaguay sólo alcanzaba sólo a 47 y 45 dólaresrespectivam<strong>en</strong>te (cuadro 2.8) (7).Cuadro 2.8. Gasto público social <strong>en</strong> seguridad y asist<strong>en</strong>cia social (US dólares de 2005) <strong>en</strong> países deSudamérica, 2000 a 2009País 2000-2001 2002-2003 2004-2005 2006-2007 2008-2009USD USD USD USD USDArg<strong>en</strong>tina 452 380 418 530 690Bolivia 55 60 55 51 66Brasil 492 534 569 642 711Chile 500 492 465 440 545Colombia 148 155 202 257 300Ecuador 12 9 15 28 47Paraguay 25 40 31 42 45Perú 98 114 123 118 113Uruguay 670 589 591 675 719V<strong>en</strong>ezuela 196 184 214 270 …Sudamérica 360 373 402 460 542Nota: Guyana y Suriname sin informaciónFu<strong>en</strong>te: CEPAL 2011, Panorama Social de América Latina y el Caribe, 2011Entre 2000-2001 y 2008-2009, el gasto públicosocial <strong>en</strong> seguridad y asist<strong>en</strong>cia social como porc<strong>en</strong>tajedel producto interno bruto, aum<strong>en</strong>tó de 8,4% a 10,5%<strong>en</strong> los países de Sudamérica, aunque con un amplio unrango <strong>en</strong>tre países, pues mi<strong>en</strong>tras que <strong>en</strong> Brasilrepres<strong>en</strong>taba el 13,4%, <strong>en</strong> Ecuador sólo alcanzaba al1,5% (cuadro 2.9) (7).La protección social a través de la seguridad socialcumple un rol importante <strong>en</strong> la población que trabaja ypuede contribuir a sistemas previsionales. La coberturade la seguridad social permite a los trabajadores estarsocialm<strong>en</strong>te protegidos mediante afiliación a sistemasprevisionales y t<strong>en</strong>er acceso a los sistemas y seguros de<strong>salud</strong>. En 2006, dos tercios de las personas ocupadas30
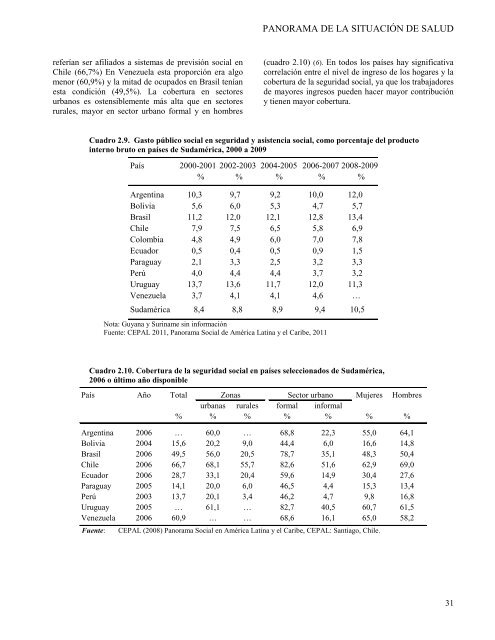
PANORAMA DE LA SITUACIÓN DE SALUDreferían ser afiliados a sistemas de previsión social <strong>en</strong>Chile (66,7%) En V<strong>en</strong>ezuela esta proporción era algom<strong>en</strong>or (60,9%) y la mitad de ocupados <strong>en</strong> Brasil t<strong>en</strong>íanesta condición (49,5%). La cobertura <strong>en</strong> sectoresurbanos es ost<strong>en</strong>siblem<strong>en</strong>te más alta que <strong>en</strong> sectoresrurales, mayor <strong>en</strong> sector urbano formal y <strong>en</strong> hombres(cuadro 2.10) (6). En todos los países hay significativacorrelación <strong>en</strong>tre el nivel de ingreso de los hogares y lacobertura de la seguridad social, ya que los trabajadoresde mayores ingresos pued<strong>en</strong> hacer mayor contribucióny ti<strong>en</strong><strong>en</strong> mayor cobertura.Cuadro 2.9. Gasto público social <strong>en</strong> seguridad y asist<strong>en</strong>cia social, como porc<strong>en</strong>taje del productointerno bruto <strong>en</strong> países de Sudamérica, 2000 a 2009País2000-2001 2002-2003 2004-2005 2006-2007 2008-2009% % % % %Arg<strong>en</strong>tina 10,3 9,7 9,2 10,0 12,0Bolivia 5,6 6,0 5,3 4,7 5,7Brasil 11,2 12,0 12,1 12,8 13,4Chile 7,9 7,5 6,5 5,8 6,9Colombia 4,8 4,9 6,0 7,0 7,8Ecuador 0,5 0,4 0,5 0,9 1,5Paraguay 2,1 3,3 2,5 3,2 3,3Perú 4,0 4,4 4,4 3,7 3,2Uruguay 13,7 13,6 11,7 12,0 11,3V<strong>en</strong>ezuela 3,7 4,1 4,1 4,6 …Sudamérica 8,4 8,8 8,9 9,4 10,5Nota: Guyana y Suriname sin informaciónFu<strong>en</strong>te: CEPAL 2011, Panorama Social de América Latina y el Caribe, 2011Cuadro 2.10. Cobertura de la seguridad social <strong>en</strong> países seleccionados de Sudamérica,2006 o último año disponiblePaís Año Total ZonasSector urbano Mujeres Hombresurbanas rurales formal informal% % % % % % %Arg<strong>en</strong>tina 2006 … 60,0 … 68,8 22,3 55,0 64,1Bolivia 2004 15,6 20,2 9,0 44,4 6,0 16,6 14,8Brasil 2006 49,5 56,0 20,5 78,7 35,1 48,3 50,4Chile 2006 66,7 68,1 55,7 82,6 51,6 62,9 69,0Ecuador 2006 28,7 33,1 20,4 59,6 14,9 30,4 27,6Paraguay 2005 14,1 20,0 6,0 46,5 4,4 15,3 13,4Perú 2003 13,7 20,1 3,4 46,2 4,7 9,8 16,8Uruguay 2005 … 61,1 … 82,7 40,5 60,7 61,5V<strong>en</strong>ezuela 2006 60,9 … … 68,6 16,1 65,0 58,2Fu<strong>en</strong>te:CEPAL (2008) Panorama Social <strong>en</strong> América Latina y el Caribe, CEPAL: Santiago, Chile.31
- Page 1: Salud en SudaméricaEdición de 201
- Page 4 and 5: SALUD EN SUDAMÉRICA, 2012Se public
- Page 6 and 7: SALUD EN SUDAMÉRICA, 20124. CONDIC
- Page 8 and 9: SALUD EN SUDAMÉRICA, 2012Medio amb
- Page 10 and 11: SALUD EN SUDAMÉRICA, 2012Acrónimo
- Page 12 and 13: SALUD EN SUDAMÉRICA, 2012Resumen e
- Page 14 and 15: SALUD EN SUDAMÉRICA, 2012Cuadro 1.
- Page 16 and 17: SALUD EN SUDAMÉRICA, 2012relativa
- Page 18 and 19: SALUD EN SUDAMÉRICA, 2012Entre 200
- Page 20 and 21: SALUD EN SUDAMÉRICA, 2012Objetivos
- Page 22 and 23: SALUD EN SUDAMÉRICA, 2012Disponibl
- Page 24 and 25: SALUD EN SUDAMÉRICA, 2012Figura 2.
- Page 26 and 27: SALUD EN SUDAMÉRICA, 2012del secto
- Page 28 and 29: SALUD EN SUDAMÉRICA, 2012Chile (en
- Page 30 and 31: SALUD EN SUDAMÉRICA, 2012redes soc
- Page 34 and 35: SALUD EN SUDAMÉRICA, 2012Referenci
- Page 36 and 37: SALUD EN SUDAMÉRICA, 2012PaísCuad
- Page 38 and 39: SALUD EN SUDAMÉRICA, 2012Cuadro 3.
- Page 40 and 41: SALUD EN SUDAMÉRICA, 2012contamina
- Page 42 and 43: SALUD EN SUDAMÉRICA, 2012seguridad
- Page 44 and 45: SALUD EN SUDAMÉRICA, 2012 En Surin
- Page 46 and 47: SALUD EN SUDAMÉRICA, 20124. CONDIC
- Page 48 and 49: SALUD EN SUDAMÉRICA, 2012PaísesCu
- Page 50 and 51: SALUD EN SUDAMÉRICA, 2012Cuadro 4.
- Page 52 and 53: SALUD EN SUDAMÉRICA, 2012habitante
- Page 54 and 55: Tasa por 100 mil hab.SALUD EN SUDAM
- Page 56 and 57: SALUD EN SUDAMÉRICA, 2012Morbilida
- Page 58 and 59: SALUD EN SUDAMÉRICA, 2012amazónic
- Page 60 and 61: SALUD EN SUDAMÉRICA, 2012hidatidos
- Page 62 and 63: SALUD EN SUDAMÉRICA, 2012 En Surin
- Page 64 and 65: SALUD EN SUDAMÉRICA, 2012inadecuad
- Page 66 and 67: SALUD EN SUDAMÉRICA, 20125. POLÍT
- Page 68 and 69: SALUD EN SUDAMÉRICA, 2012Sistema
- Page 70 and 71: SALUD EN SUDAMÉRICA, 2012Chile tie
- Page 72 and 73: SALUD EN SUDAMÉRICA, 2012asistenci
- Page 74 and 75: SALUD EN SUDAMÉRICA, 2012Figura 5.
- Page 76 and 77: SALUD EN SUDAMÉRICA, 2012contribuy
- Page 78 and 79: SALUD EN SUDAMÉRICA, 201211. Organ
- Page 80 and 81: SALUD EN SUDAMÉRICA, 2012urbanos y
- Page 82 and 83:
SALUD EN SUDAMÉRICA, 2012Enseñanz
- Page 84 and 85:
SALUD EN SUDAMÉRICA, 2012 Maternid
- Page 86 and 87:
SALUD EN SUDAMÉRICA, 2012Comisione
- Page 88 and 89:
SALUD EN SUDAMÉRICA, 2012Quito Dis
- Page 90 and 91:
SALUD EN SUDAMÉRICA, 2012acumulan
- Page 92 and 93:
SALUD EN SUDAMÉRICA, 2012de Sudam
- Page 94 and 95:
SALUD EN SUDAMÉRICA, 2012y Colombi
- Page 96:
SALUD EN SUDAMÉRICA, 2012sudameric