vgbe energy journal 11 (2022) - International Journal for Generation and Storage of Electricity and Heat
vgbe energy journal - International Journal for Generation and Storage of Electricity and Heat. Issue 11 (2022). Technical Journal of the vgbe energy e.V. - Energy is us! NOTICE: Please feel free to read this free copy of the vgbe energy journal. This is our temporary contribution to support experience exchange in the energy industry during Corona times. The printed edition, subscription as well as further services are available on our website, www.vgbe.energy +++++++++++++++++++++++++++++++++++++++++++++++++++++++
vgbe energy journal - International Journal for Generation and Storage of Electricity and Heat.
Issue 11 (2022).
Technical Journal of the vgbe energy e.V. - Energy is us!
NOTICE: Please feel free to read this free copy of the vgbe energy journal. This is our temporary contribution to support experience exchange in the energy industry during Corona times. The printed edition, subscription as well as further services are available on our website, www.vgbe.energy
+++++++++++++++++++++++++++++++++++++++++++++++++++++++
- Keine Tags gefunden...

Sie wollen auch ein ePaper? Erhöhen Sie die Reichweite Ihrer Titel.
YUMPU macht aus Druck-PDFs automatisch weboptimierte ePaper, die Google liebt.
Future Energy Systems<br />
Tab. 2. Definition <strong>and</strong> share <strong>of</strong> Scenario types used in <strong>energy</strong> system studies.<br />
Scenario type Share Definition<br />
Trend 12 % Trend scenarios are based on the extrapolation <strong>of</strong> current<br />
political <strong>and</strong> legal measures into the future. There<strong>for</strong>e, no<br />
additional expansion targets or other further constraints are<br />
imposed on the model.<br />
Reference 16 % The term reference scenario is generally used to describe<br />
scenarios that are used as the basis <strong>of</strong> a more advanced<br />
comparison. Moderate developments are <strong>of</strong>ten assumed <strong>for</strong><br />
the future, which means that trend scenarios are usually used<br />
as a reference.<br />
High ambition 46 % Ambitious scenarios refer to scenarios that go beyond current<br />
policies. In most cases, this means a faster or stronger<br />
reduction <strong>of</strong> greenhouse gas emissions or an accelerated<br />
expansion <strong>of</strong> renewable energies. However, this can also mean<br />
societal aspects, such as a change in values toward <strong>energy</strong>saving<br />
behaviors.<br />
Low ambition 12 % Low-ambition scenarios represent the opposite compared to<br />
the ambitious ones. Climate protection targets are given low<br />
priority overall. For example, existing climate protection<br />
measures are dropped or missed. Also considered here is<br />
possible societal unacceptance toward savings measures or<br />
individual technologies.<br />
Others 14 % If a scenario cannot be assigned to any <strong>of</strong> the four categories<br />
mentioned, it is classified as another scenario.<br />
Tab. 3. Overview <strong>of</strong> the evaluated characteristics.<br />
Characteristic high mid low NA Definition<br />
Society 8 % 71 % 7 % 14 % Social acceptance <strong>and</strong> support<br />
Ambition 39 % 44 % 17 % 0 % Level <strong>of</strong> ambition <strong>of</strong> climate protection<br />
measures<br />
Certainty 41 % 44 % 5 % 10 % Probability <strong>of</strong> assumptions occurring<br />
Grid 53 % 25 % 7 % 15 % Flexibility <strong>of</strong> domestic transmission<br />
Trade 56 % 7 % 19 % 19 % Role <strong>of</strong> EU-wide import/export<br />
Openness 54 % 17 % 27 % 2 % Degree <strong>of</strong> predictability <strong>of</strong> the future<br />
<strong>energy</strong> system<br />
Sector coupling 56 % 24 % 2 % 19 % Degree <strong>of</strong> electrification in the heat <strong>and</strong><br />
mobility sectors<br />
Speed 31 % 22 % 19 % 29 % Speed <strong>of</strong> implementation <strong>of</strong> <strong>energy</strong> policy<br />
measures<br />
Characteristic Yes No NA Definition<br />
Coal phase-out 40 % 37 % 23 % Fixed phase-out target <strong>for</strong> 2038<br />
Nuclear phase-out 87 % 0 % 13 % No use <strong>of</strong> nuclear power after <strong>2022</strong><br />
80 % GHG 1 reduction 57 % 7 % 36 % Achieve the reduction target <strong>of</strong> -80 %<br />
compared to 1990<br />
95 % GHG 1 reduction 38 % 26 % 36 % Achieve the reduction target <strong>of</strong> -95 %<br />
compared to 1990<br />
1<br />
GHG: greenhouse gas<br />
os in <strong>energy</strong> system studies. A list <strong>of</strong> the characteristics<br />
used in this work, their definition<br />
<strong>and</strong> their respective share per gradation is<br />
summarized in Ta b l e 3 .<br />
3 Results<br />
The following section serves to summarize<br />
the results <strong>of</strong> our study. Section first presents<br />
the general trend <strong>of</strong> the future development<br />
<strong>of</strong> the German <strong>energy</strong> system. This<br />
is followed in section 3.2 by an analysis <strong>of</strong><br />
the boundary conditions as an influence on<br />
the development <strong>of</strong> <strong>energy</strong> systems.<br />
3.1 Summary <strong>of</strong> general trends<br />
This section is intended to present general<br />
trends in <strong>energy</strong> supply in a possible future<br />
German <strong>energy</strong> system. First, electricity<br />
generation via renewables <strong>and</strong> the dem<strong>and</strong><br />
<strong>for</strong> conventional power plants will be discussed,<br />
be<strong>for</strong>e topics such as the increasing<br />
dem<strong>and</strong> <strong>for</strong> hydrogen <strong>and</strong> sector coupling<br />
are addressed. For a simplified representation<br />
<strong>of</strong> the data, the median, upper <strong>and</strong> lower<br />
quartile, <strong>and</strong> total range <strong>of</strong> the evaluated<br />
data subset is used und presented in different<br />
shading. Additionally, in the upper part<br />
<strong>of</strong> the figures nsum <strong>and</strong> nmin represent the<br />
total number <strong>of</strong> used scenarios <strong>and</strong> the minimum<br />
number <strong>of</strong> scenarios <strong>for</strong> each considered<br />
timestep.<br />
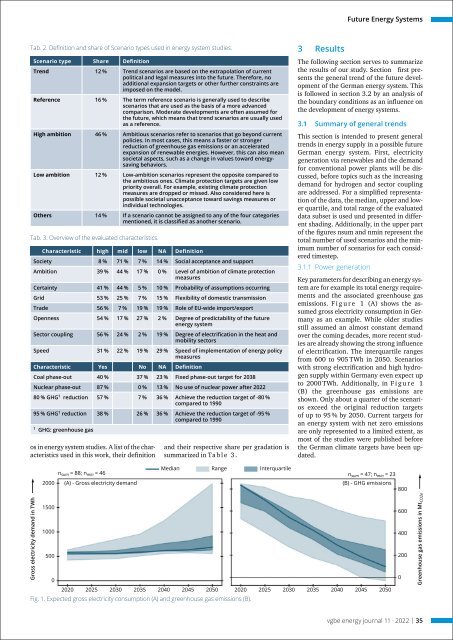
3.1.1 Power generation<br />
Key parameters <strong>for</strong> describing an <strong>energy</strong> system<br />
are <strong>for</strong> example its total <strong>energy</strong> requirements<br />
<strong>and</strong> the associated greenhouse gas<br />
emissions. F i g u r e 1 (A) shows the assumed<br />
gross electricity consumption in Germany<br />
as an example. While older studies<br />
still assumed an almost constant dem<strong>and</strong><br />
over the coming decades, more recent studies<br />
are already showing the strong influence<br />
<strong>of</strong> electrification. The interquartile ranges<br />
from 600 to 905 TWh in 2050. Scenarios<br />
with strong electrification <strong>and</strong> high hydrogen<br />
supply within Germany even expect up<br />
to 2000 TWh. Additionally, in F i g u r e 1<br />
(B) the greenhouse gas emissions are<br />
shown. Only about a quarter <strong>of</strong> the scenarios<br />
exceed the original reduction targets<br />
<strong>of</strong> up to 95 % by 2050. Current targets <strong>for</strong><br />
an <strong>energy</strong> system with net zero emissions<br />
are only represented to a limited extent, as<br />
most <strong>of</strong> the studies were published be<strong>for</strong>e<br />
the German climate targets have been updated.<br />
Median Range lnterquartile<br />
n sum = 88; n min = 46 n sum = 47; n min = 23<br />
Gross electricity dem<strong>and</strong> in TWh<br />
2000<br />
1500<br />
1000<br />
500<br />
0<br />
(A) - Gross electricity dem<strong>and</strong><br />
(B) - GHG emissions<br />
2020 2025 2030 2035 2040 2045 2050 2020 2025 2030 2035 2040 2045 2050<br />
Fig. 1. Expected gross electricity consumption (A) <strong>and</strong> greenhouse gas emissions (B).<br />
800<br />
600<br />
400<br />
200<br />
0<br />
Greenhouse gas emissions in Mt CO2e<br />
<strong>vgbe</strong> <strong>energy</strong> <strong>journal</strong> <strong>11</strong> · <strong>2022</strong> | 35