vgbe energy journal 11 (2022) - International Journal for Generation and Storage of Electricity and Heat
vgbe energy journal - International Journal for Generation and Storage of Electricity and Heat. Issue 11 (2022). Technical Journal of the vgbe energy e.V. - Energy is us! NOTICE: Please feel free to read this free copy of the vgbe energy journal. This is our temporary contribution to support experience exchange in the energy industry during Corona times. The printed edition, subscription as well as further services are available on our website, www.vgbe.energy +++++++++++++++++++++++++++++++++++++++++++++++++++++++
vgbe energy journal - International Journal for Generation and Storage of Electricity and Heat.
Issue 11 (2022).
Technical Journal of the vgbe energy e.V. - Energy is us!
NOTICE: Please feel free to read this free copy of the vgbe energy journal. This is our temporary contribution to support experience exchange in the energy industry during Corona times. The printed edition, subscription as well as further services are available on our website, www.vgbe.energy
+++++++++++++++++++++++++++++++++++++++++++++++++++++++
- Keine Tags gefunden...

Sie wollen auch ein ePaper? Erhöhen Sie die Reichweite Ihrer Titel.
YUMPU macht aus Druck-PDFs automatisch weboptimierte ePaper, die Google liebt.
Future Energy Systems<br />
cations adds up to over 200 TWh in 2050.<br />
However, this is also unlikely to meet the<br />
total dem<strong>and</strong> <strong>for</strong> power-to-X products, resulting<br />
in an additional net import <strong>of</strong> synthetic<br />
<strong>energy</strong> carriers <strong>of</strong> about 20 TWh in<br />
2030 <strong>and</strong> over 350 TWh in 2050.<br />
3.2 Boundary conditions<br />
As shown in the previous sections, the variables<br />
in <strong>energy</strong> system studies are subject to<br />
a large variance the further into the future<br />
the scenarios are. The aim <strong>of</strong> this section is<br />
to explain some <strong>of</strong> the scatter by relating it<br />
to individual parameters. The selection<br />
<strong>of</strong> <strong>energy</strong> system parameters used <strong>for</strong> the<br />
criteria-based analysis are listed in Ta -<br />
b l e 5 . In addition, <strong>for</strong> each parameter it is<br />
listed how much influence is to be attributed<br />
to the respective criterion <strong>and</strong> in which direction<br />
the influence extends. Individual<br />
parameters <strong>and</strong> criteria are selected in the<br />
following in order to discuss the influence <strong>of</strong><br />
the respective criterion in more detail. The<br />
graphs used <strong>for</strong> this purpose include the<br />
criterion-dependent developments <strong>of</strong> the<br />
variables considered over the period from<br />
2020 to 2050. In addition, their variance in<br />
2050 is shown in the <strong>for</strong>m <strong>of</strong> box plots, also<br />
grouped by criterion. This evaluation is<br />
based only on a subset <strong>of</strong> the above listed<br />
studies.<br />
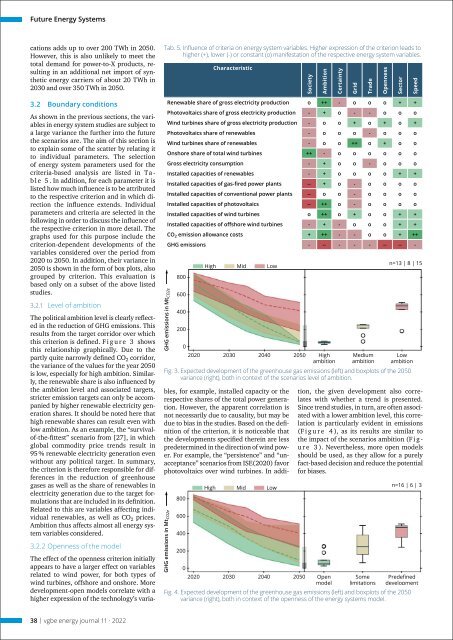
3.2.1 Level <strong>of</strong> ambition<br />
The political ambition level is clearly reflected<br />
in the reduction <strong>of</strong> GHG emissions. This<br />
results from the target corridor over which<br />
this criterion is defined. F i g u r e 3 shows<br />
this relationship graphically. Due to the<br />
partly quite narrowly defined CO 2 corridor,<br />
the variance <strong>of</strong> the values <strong>for</strong> the year 2050<br />
is low, especially <strong>for</strong> high ambition. Similarly,<br />
the renewable share is also influenced by<br />
the ambition level <strong>and</strong> associated targets,<br />
stricter emission targets can only be accompanied<br />
by higher renewable electricity generation<br />
shares. It should be noted here that<br />
high renewable shares can result even with<br />
low ambition. As an example, the “survival<strong>of</strong>-the-fittest”<br />
scenario from [27], in which<br />
global commodity price trends result in<br />
95 % renewable electricity generation even<br />
without any political target. In summary,<br />
the criterion is there<strong>for</strong>e responsible <strong>for</strong> differences<br />
in the reduction <strong>of</strong> greenhouse<br />
gases as well as the share <strong>of</strong> renewables in<br />
electricity generation due to the target <strong>for</strong>mulations<br />
that are included in its definition.<br />
Related to this are variables affecting individual<br />
renewables, as well as CO 2 prices.<br />
Ambition thus affects almost all <strong>energy</strong> system<br />
variables considered.<br />
3.2.2 Openness <strong>of</strong> the model<br />
Tab. 5. Influence <strong>of</strong> criteria on <strong>energy</strong> system variables. Higher expression <strong>of</strong> the criterion leads to<br />
higher (+), lower (-) or constant (o) manifestation <strong>of</strong> the respective <strong>energy</strong> system variables.<br />
GHG emissions in Mt CO2e<br />
Characteristic<br />
Renewable share <strong>of</strong> gross electricity production o ++ - o o o + +<br />
Photovoltaics share <strong>of</strong> gross electricity production - + o - - o o o<br />
Wind turbines share <strong>of</strong> gross electricity production - o o + o + o +<br />
Photovoltaics share <strong>of</strong> renewables - o o o - o o o<br />
Wind turbines share <strong>of</strong> renewables - o o ++ o + o o<br />
Onshore share <strong>of</strong> total wind turbines ++ - o o o o o o<br />
Gross electricity consumption - + o o - o o o<br />
Installed capacities <strong>of</strong> renewables - + o o o o + +<br />
Installed capacities <strong>of</strong> gas-fired power plants -- + o - o o o o<br />
Installed capacities <strong>of</strong> conventional power plants -- o o - o o o o<br />
Installed capacities <strong>of</strong> photovoltaics -- ++ o - o o o o<br />
Installed capacities <strong>of</strong> wind turbines o ++ o + o o + +<br />
Installed capacities <strong>of</strong> <strong>of</strong>fshore wind turbines - + - o o o + +<br />
CO 2 emission allowance costs + ++ - - o o + ++<br />
GHG emissions - -- - - - -- -- -<br />
800<br />
600<br />
400<br />
200<br />
High Mid Low<br />
0<br />
2020 2030 2040 2050<br />
Society<br />
Ambition<br />
High<br />
ambition<br />
Certainty<br />
Grid<br />
Trade<br />
Medium<br />
ambition<br />
Openness<br />
Sector<br />
Speed<br />
n=13 | 8 | 15<br />
Low<br />
ambition<br />
Fig. 3. Expected development <strong>of</strong> the greenhouse gas emissions (left) <strong>and</strong> boxplots <strong>of</strong> the 2050<br />
variance (right), both in context <strong>of</strong> the scenarios level <strong>of</strong> ambition.<br />
GHG emissions in Mt CO2e<br />
800<br />
600<br />
400<br />
200<br />
0<br />
High Mid Low<br />
2020 2030 2040 2050<br />
The effect <strong>of</strong> the openness criterion initially<br />
appears to have a larger effect on variables<br />
related to wind power, <strong>for</strong> both types <strong>of</strong><br />
wind turbines, <strong>of</strong>fshore <strong>and</strong> onshore. More<br />
development-open models correlate with a<br />
higher expression <strong>of</strong> the technology’s variables,<br />
<strong>for</strong> example, installed capacity or the<br />
respective shares <strong>of</strong> the total power generation.<br />
However, the apparent correlation is<br />
not necessarily due to causality, but may be<br />
due to bias in the studies. Based on the definition<br />
<strong>of</strong> the criterion, it is noticeable that<br />
the developments specified therein are less<br />
predetermined in the direction <strong>of</strong> wind power.<br />
For example, the “persistence” <strong>and</strong> “unacceptance”<br />
scenarios from ISE(2020) favor<br />
photovoltaics over wind turbines. In addition,<br />
the given development also correlates<br />
with whether a trend is presented.<br />
Since trend studies, in turn, are <strong>of</strong>ten associated<br />
with a lower ambition level, this correlation<br />
is particularly evident in emissions<br />
(F i g u r e 4 ), as its results are similar to<br />
the impact <strong>of</strong> the scenarios ambition (F i g -<br />
u r e 3 ). Nevertheless, more open models<br />
should be used, as they allow <strong>for</strong> a purely<br />
fact-based decision <strong>and</strong> reduce the potential<br />
<strong>for</strong> biases.<br />
Open<br />
model<br />
Some<br />
limitations<br />
n=16 | 6 | 3<br />
Predefined<br />
development<br />
Fig. 4. Expected development <strong>of</strong> the greenhouse gas emissions (left) <strong>and</strong> boxplots <strong>of</strong> the 2050<br />
variance (right), both in context <strong>of</strong> the openness <strong>of</strong> the <strong>energy</strong> systems model.<br />
38 | <strong>vgbe</strong> <strong>energy</strong> <strong>journal</strong> <strong>11</strong> · <strong>2022</strong>