vgbe energy journal 11 (2022) - International Journal for Generation and Storage of Electricity and Heat
vgbe energy journal - International Journal for Generation and Storage of Electricity and Heat. Issue 11 (2022). Technical Journal of the vgbe energy e.V. - Energy is us! NOTICE: Please feel free to read this free copy of the vgbe energy journal. This is our temporary contribution to support experience exchange in the energy industry during Corona times. The printed edition, subscription as well as further services are available on our website, www.vgbe.energy +++++++++++++++++++++++++++++++++++++++++++++++++++++++
vgbe energy journal - International Journal for Generation and Storage of Electricity and Heat.
Issue 11 (2022).
Technical Journal of the vgbe energy e.V. - Energy is us!
NOTICE: Please feel free to read this free copy of the vgbe energy journal. This is our temporary contribution to support experience exchange in the energy industry during Corona times. The printed edition, subscription as well as further services are available on our website, www.vgbe.energy
+++++++++++++++++++++++++++++++++++++++++++++++++++++++
- Keine Tags gefunden...

Sie wollen auch ein ePaper? Erhöhen Sie die Reichweite Ihrer Titel.
YUMPU macht aus Druck-PDFs automatisch weboptimierte ePaper, die Google liebt.
World Energy Outlook <strong>2022</strong> – Summary<br />
Coal unabated<br />
Natural gas unabated<br />
Other<br />
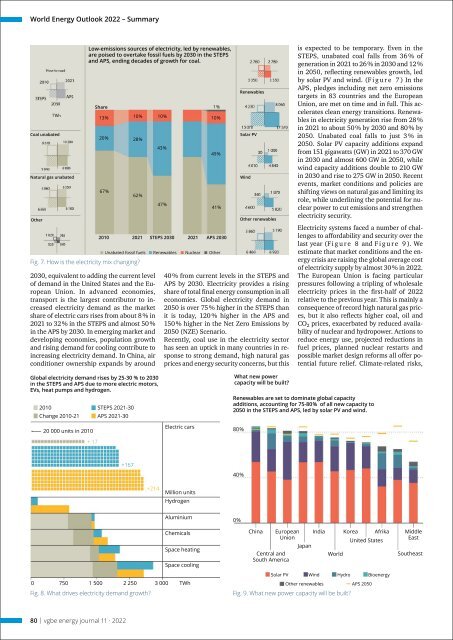
Low-emissions sources <strong>of</strong> electricity, led by renewables,<br />
are poised to overtake fossil fuels by 2030 in the STEPS<br />
<strong>and</strong> APS, ending decades <strong>of</strong> growth <strong>for</strong> coal.<br />
Share<br />
13 %<br />
10 %<br />
20 % 28 %<br />
67 %<br />
62 %<br />
Fig. 7. How is the electricity mix changing?<br />
2030, equivalent to adding the current level<br />
<strong>of</strong> dem<strong>and</strong> in the United States <strong>and</strong> the European<br />
Union. In advanced economies,<br />
transport is the largest contributor to increased<br />
electricity dem<strong>and</strong> as the market<br />
share <strong>of</strong> electric cars rises from about 8 % in<br />
2021 to 32 % in the STEPS <strong>and</strong> almost 50 %<br />
in the APS by 2030. In emerging market <strong>and</strong><br />
developing economies, population growth<br />
<strong>and</strong> rising dem<strong>and</strong> <strong>for</strong> cooling contribute to<br />
increasing electricity dem<strong>and</strong>. In China, air<br />
conditioner ownership exp<strong>and</strong>s by around<br />
10 %<br />
43 %<br />
47 %<br />
1 %<br />
10 %<br />
49 %<br />
41 %<br />
2010 2021 STEPS 2030 2021 APS 2030<br />
Unabated fossil fuels Renewables Nuclear Other<br />
Renewables<br />
Solar PV<br />
Wind<br />
Other renewables<br />
40 % from current levels in the STEPS <strong>and</strong><br />
APS by 2030. <strong>Electricity</strong> provides a rising<br />
share <strong>of</strong> total final <strong>energy</strong> consumption in all<br />
economies. Global electricity dem<strong>and</strong> in<br />
2050 is over 75 % higher in the STEPS than<br />
it is today, 120 % higher in the APS <strong>and</strong><br />
150 % higher in the Net Zero Emissions by<br />
2050 (NZE) Scenario.<br />
Recently, coal use in the electricity sector<br />
has seen an uptick in many countries in response<br />
to strong dem<strong>and</strong>, high natural gas<br />
prices <strong>and</strong> <strong>energy</strong> security concerns, but this<br />
is expected to be temporary. Even in the<br />
STEPS, unabated coal falls from 36 % <strong>of</strong><br />
generation in 2021 to 26 % in 2030 <strong>and</strong> 12 %<br />
in 2050, reflecting renewables growth, led<br />
by solar PV <strong>and</strong> wind. (F i g u r e 7 ) In the<br />
APS, pledges including net zero emissions<br />
targets in 83 countries <strong>and</strong> the European<br />
Union, are met on time <strong>and</strong> in full. This accelerates<br />
clean <strong>energy</strong> transitions. Renewables<br />
in electricity generation rise from 28 %<br />
in 2021 to about 50 % by 2030 <strong>and</strong> 80 % by<br />
2050. Unabated coal falls to just 3 % in<br />
2050. Solar PV capacity additions exp<strong>and</strong><br />
from 151 gigawatts (GW) in 2021 to 370 GW<br />
in 2030 <strong>and</strong> almost 600 GW in 2050, while<br />
wind capacity additions double to 210 GW<br />
in 2030 <strong>and</strong> rise to 275 GW in 2050. Recent<br />
events, market conditions <strong>and</strong> policies are<br />
shifting views on natural gas <strong>and</strong> limiting its<br />
role, while underlining the potential <strong>for</strong> nuclear<br />
power to cut emissions <strong>and</strong> strengthen<br />
electricity security.<br />
<strong>Electricity</strong> systems faced a number <strong>of</strong> challenges<br />
to af<strong>for</strong>dability <strong>and</strong> security over the<br />
last year (F i g u r e 8 <strong>and</strong> F i g u r e 9 ). We<br />
estimate that market conditions <strong>and</strong> the <strong>energy</strong><br />
crisis are raising the global average cost<br />
<strong>of</strong> electricity supply by almost 30 % in <strong>2022</strong>.<br />
The European Union is facing particular<br />
pressures following a tripling <strong>of</strong> wholesale<br />
electricity prices in the first-half <strong>of</strong> <strong>2022</strong><br />
relative to the previous year. This is mainly a<br />
consequence <strong>of</strong> record high natural gas prices,<br />
but it also reflects higher coal, oil <strong>and</strong><br />
CO 2 prices, exacerbated by reduced availability<br />
<strong>of</strong> nuclear <strong>and</strong> hydropower. Actions to<br />
reduce <strong>energy</strong> use, projected reductions in<br />
fuel prices, planned nuclear restarts <strong>and</strong><br />
possible market design re<strong>for</strong>ms all <strong>of</strong>fer potential<br />
future relief. Climate-related risks,<br />
Global electricity dem<strong>and</strong> rises by 25-30 % to 2030<br />
in the STEPS <strong>and</strong> APS due to more electric motors,<br />
EVs, heat pumps <strong>and</strong> hydrogen.<br />
2010<br />
Change 2010-21<br />
20 000 units in 2010<br />
+ 17<br />
STEPS 2021-30<br />
APS 2021-30<br />
Electric cars<br />
What new power<br />
capacity will be built?<br />
Renewables are set to dominate global capacity<br />
additions, accounting <strong>for</strong> 75-80 % <strong>of</strong> all new capacity to<br />
2050 in the STEPS <strong>and</strong> APS, led by solar PV <strong>and</strong> wind.<br />
80 %<br />
+167<br />
+214<br />
Million units<br />
Hydrogen<br />
40 %<br />
Aluminium<br />
0 %<br />
Chemicals<br />
Space heating<br />
Space cooling<br />
0 750 1 500 2 250 3 000 TWh<br />
Fig. 8. What drives electricity dem<strong>and</strong> growth?<br />
China European India Korea Afrika Middle<br />
Union<br />
United States<br />
East<br />
Japan<br />
Central <strong>and</strong><br />
South America<br />
World<br />
Southeast Asia<br />
Solar PV Wind Hydro Bio<strong>energy</strong><br />
Other renewables APS 2050<br />
Fig. 9. What new power capacity will be built?<br />
80 | <strong>vgbe</strong> <strong>energy</strong> <strong>journal</strong> <strong>11</strong> · <strong>2022</strong>