- Page 1 and 2:
Endangered Species Act Section 7 Co
- Page 3 and 4:
Rockfish ..........................
- Page 5 and 6:
LIST of TABLES Table 1. Species Lis
- Page 7 and 8:
Agency: Activities Considered: Nati
- Page 9 and 10:
allast water volume. They also agre
- Page 11 and 12:
� Distillation and Reverse Osmosi
- Page 13 and 14:
� Conduct fueling in a manner tha
- Page 15 and 16:
stability of the ship. Any discharg
- Page 17 and 18:
� Annual calibration of ballast w
- Page 19 and 20:
The discharge of Tributyltin (TBT)
- Page 21 and 22:
For vessels covered under the VGP,
- Page 23 and 24:
For vessels covered under the VGP,
- Page 25 and 26:
waters (Appendix G, VGP). Non-Oily
- Page 27 and 28:
� Limiting use of hard brushes an
- Page 29 and 30:
adjusted upward for lower washwater
- Page 31 and 32:
� Dispose of the graywater at an
- Page 33 and 34:
� Appropriate reprimand procedure
- Page 35 and 36:
Under the VGP, the EPA authorizes t
- Page 37 and 38:
� Ensuring material storage, and
- Page 39 and 40:
2. Voyage Log. Include the dates an
- Page 41 and 42:
tanks in ballast. Use units of meas
- Page 43 and 44:
USC §1001 or 18 USC §1519. To mon
- Page 45 and 46:
discharges to an impaired water wit
- Page 47 and 48:
� Prevent monofilament line, fish
- Page 49 and 50:
Ballast Water. For vessels covered
- Page 51 and 52:
submitted or required to be maintai
- Page 53 and 54:
� Use soaps and detergents that a
- Page 55 and 56:
eports in time to make changes for
- Page 57 and 58:
for these components of an action);
- Page 60 and 61:
Regardless of whether an agency’s
- Page 62 and 63:
suspected to produce physical, phys
- Page 64 and 65:
Response Analyses We conduct a deta
- Page 66 and 67:
iotic phenomena to a degree that wo
- Page 68 and 69:
seaward a distance of three miles.
- Page 70 and 71:
Table 1. Species Listed as Threaten
- Page 72 and 73:
Based upon our analyses, we conclud
- Page 74 and 75:
11. Certain park pest management ac
- Page 76 and 77:
alter macroinvertebrate communities
- Page 78 and 79:
support one or more Chinook salmon
- Page 80 and 81:
quality growth, reproduction, and f
- Page 82 and 83:
quality and quantity, natural cover
- Page 84 and 85:
occurs in residence time in fresh w
- Page 86 and 87:
This ESU consists of a single spawn
- Page 88 and 89:
Status and Trends NMFS originally l
- Page 90 and 91:
Critical Habitat NMFS designated cr
- Page 92 and 93:
support one or more Chinook salmon
- Page 94 and 95:
Most of the chum within this ESU re
- Page 96 and 97:
On average Hood Canal chum salmon r
- Page 98 and 99:
estuaries and in fresh water coho s
- Page 100 and 101:
FR 24049). The designation encompas
- Page 102 and 103:
100,000 fish by the mid-1960s with
- Page 104 and 105:
1996). However, the decline in prod
- Page 106 and 107:
other tributaries flowing into Ozet
- Page 108 and 109:
Status and Trends Snake River socke
- Page 110 and 111:
parts of pools, while winter rearin
- Page 112 and 113:
Creek, Waddell Creek, Gazos Creek,
- Page 114 and 115:
1996). Steelhead in these basins tr
- Page 116 and 117:
Cowlitz Trout Hatchery winter-run p
- Page 118 and 119:
White Salmon River and Deschutes Cr
- Page 120 and 121:
Status and Trends NMFS listed North
- Page 122 and 123:
summer-run fish, comprising 37 of t
- Page 124 and 125:
status as threatened on January 5,
- Page 126 and 127:
elow the dam and the older dam coun
- Page 128 and 129:
extirpated due to dewatering or bar
- Page 130 and 131:
to 3,714 while naturally produced s
- Page 132 and 133:
The smolt migration past Willamette
- Page 134 and 135:
Movement, growth, and reproduction
- Page 136 and 137:
date, Atlantic salmon are listed in
- Page 138 and 139:
1997, Somero and Hofmann 1997, Van
- Page 140 and 141:
Southern Pacific Eulachon Eulachon
- Page 142 and 143:
Threats Natural Threats. Birds and
- Page 144 and 145:
are low in comparison to catch leve
- Page 146 and 147:
Female shortnose sturgeon spawn eve
- Page 148 and 149:
Anthropogenic Threats. Historic fis
- Page 150 and 151:
of all life stages in the riverine
- Page 152 and 153:
adults generally migrate upriver in
- Page 154 and 155:
Bocaccio are live-bearers with inte
- Page 156 and 157:
ycatch and habitat loss are also hu
- Page 158 and 159:
historical population in the Strait
- Page 160 and 161:
During each annual spawning event,
- Page 162 and 163:
Caribbean and Central America, the
- Page 164 and 165:
occur regularly in waters in excess
- Page 166 and 167:
Natural threats The primary natural
- Page 168 and 169:
diets (Reich et al. 2010, Vander Za
- Page 170 and 171:
fish, jellyfish, mollusks, and tuni
- Page 172 and 173:
sea turtle survival and recovery in
- Page 174 and 175:
Leatherback sea turtle (Dermochelys
- Page 176 and 177:
in leatherbacks and can block gastr
- Page 178 and 179:
the population has experienced a co
- Page 180 and 181:
Strandings may represent a signific
- Page 182 and 183:
eulachon, Pacific cod, walleye poll
- Page 184 and 185:
which makes it potentially vulnerab
- Page 186 and 187:
North Atlantic right whales exhibit
- Page 188 and 189:
impeded by competition with other w
- Page 190 and 191:
Southern Oceans. Most populations m
- Page 192 and 193:
Nemoto 1959, Nemoto 1970, Krieger a
- Page 194 and 195:
Natural threats The overriding thre
- Page 196 and 197:
planktonic larvae form before settl
- Page 198 and 199:
than 12% on many reefs (Rogers et a
- Page 200 and 201: Critical habitat NMFS published a f
- Page 202 and 203: Natural threats Natural pressures e
- Page 204 and 205: Black abalone have also experienced
- Page 206 and 207: 2009). The largest known groups of
- Page 208 and 209: areas compared to historical condit
- Page 210 and 211: Louisiana parakeet (Conuropsis caro
- Page 212 and 213: another 2.5 to 4°F during the wint
- Page 214 and 215: Table 2. Phenomena associated with
- Page 216 and 217: In addition to these changes, clima
- Page 218 and 219: as other Chinook salmon populations
- Page 220 and 221: Effects of the Action The Effects o
- Page 222 and 223: fuel barges, crane barges, dry bulk
- Page 224 and 225: and only 3% of emergency vessels ar
- Page 226 and 227: propeller) to create thrust and det
- Page 228 and 229: 36 weeks from 1850 to 1995, but in
- Page 230 and 231: � Minimize the transport of any v
- Page 232 and 233: information about the distribution
- Page 234 and 235: The uptake and discharge of ballast
- Page 236 and 237: quantify the annual number of newly
- Page 238 and 239: Stressors Established ANS are stres
- Page 240 and 241: autochthonous gross primary product
- Page 242 and 243: damage to mortality. Baleen whales
- Page 244 and 245: While there are many examples of fr
- Page 246 and 247: skeleton that is free from fleshy o
- Page 248 and 249: VGP Authorized Discharge sVGP Autho
- Page 252 and 253: EPA used information for commercial
- Page 254 and 255: Aluminum, Total (μg/L) Cadmium, Di
- Page 256 and 257: Exhaust Gas Scrubber Washwater Effl
- Page 258 and 259: Table 16. Fish Hold Effluent and Cl
- Page 260 and 261: Graywater and Graywater Mixed with
- Page 262 and 263: include controllable pitch propelle
- Page 264 and 265: Discharges not Evaluated in the BE.
- Page 266 and 267: Table 23. Decision Process for thos
- Page 268 and 269: Table 23. Decision Process for thos
- Page 270 and 271: Estimates of Exposure Resulting fro
- Page 272 and 273: For the fraction of freshwater mode
- Page 274 and 275: Table 26. Estimated Receiving Water
- Page 276 and 277: Table 26. Estimated Receiving Water
- Page 278 and 279: Table 27. Estimated Receiving Water
- Page 280 and 281: Geographical Distribution and Overl
- Page 282 and 283: Bocaccio (Sebastes paucispinis), Ca
- Page 284 and 285: mg/L (USEPA 2008). Average phosphor
- Page 286 and 287: esponse follows a “one hit” mod
- Page 288 and 289: species. (Glazebrook and Campbell 1
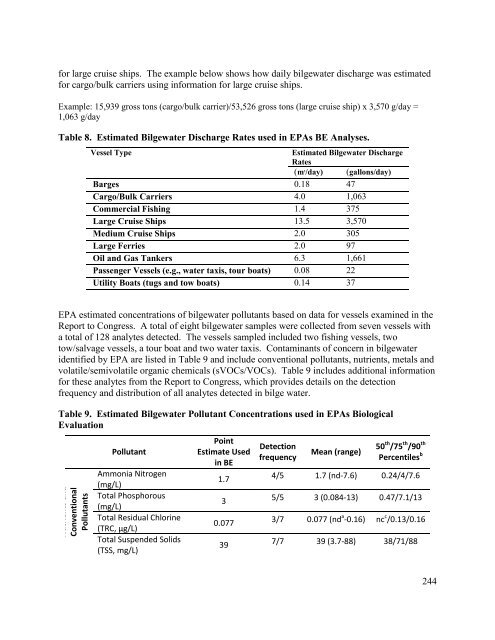
- Page 290 and 291: from large cruise vessels. The sour
- Page 292 and 293: metals in marine mammals is general
- Page 294 and 295: physiological damage to the recepto
- Page 296 and 297: the original estimates (USEPA 2012a
- Page 298 and 299: on reproduction and survival would
- Page 300 and 301:
Table 33. Application of the Ecosys
- Page 302 and 303:
metabolism of organic chemicals. Wh
- Page 304 and 305:
increased levels of suspended sedim
- Page 306 and 307:
than EPA’s HC5 TLM for benzo(a)py
- Page 308 and 309:
A later study by the same workers r
- Page 310 and 311:
(1) Scope In this section, we ask w
- Page 312 and 313:
estimate whether those discharges h
- Page 314 and 315:
analyzed due to a lack of resources
- Page 316 and 317:
concentration calculated for the hy
- Page 318 and 319:
Annually, EPA will collect and revi
- Page 320 and 321:
methodologies and understanding of
- Page 322 and 323:
traditionally requires applying dat
- Page 324 and 325:
In conclusion, the Service evaluate
- Page 326 and 327:
The VGP requires that vessel operat
- Page 328 and 329:
justified the application of signif
- Page 330 and 331:
Integration and Synthesis The EPA p
- Page 332 and 333:
population and a competitor could e
- Page 334 and 335:
Second, EPA will monitor pollutants
- Page 336 and 337:
is incidental to and not intended a
- Page 338 and 339:
minimize or avoid adverse effects o
- Page 340 and 341:
Adey, W. H. 1978. Coral reef morpho
- Page 342 and 343:
acidification causes bleaching and
- Page 344 and 345:
State University, Arcada, Californi
- Page 346 and 347:
and high-use areas of western Pacif
- Page 348 and 349:
Blum, J. P. 1988. Assessment of fac
- Page 350 and 351:
(Special Issue) 2:245-250. Browning
- Page 352 and 353:
Conservation 78:97-106. Carlton, J.
- Page 354 and 355:
River-specific target spawning requ
- Page 356 and 357:
pinniger in Canada. Committee on th
- Page 358 and 359:
comparison of reef maps from 1881 a
- Page 360 and 361:
Dustan, P. 1985. Community structur
- Page 362 and 363:
Erickson, D. L. and J. E. Hightower
- Page 364 and 365:
(Eubalaena glacialis). Aquatic Mamm
- Page 366 and 367:
Gilmore, M. D. and B. R. Hall. 1976
- Page 368 and 369:
London. Groot, C. and L. Margolis.
- Page 370 and 371:
Hanson, B., R. W. Baird, and G. Sch
- Page 372 and 373:
HDLNR. 2002. Application for an ind
- Page 374 and 375:
trawl fishery 1962-64. Washington D
- Page 376 and 377:
Comprehensive Guide to their Identi
- Page 378 and 379:
Yellowstone Ecosystem. Journal of t
- Page 380 and 381:
San Juan archipelago. Washington De
- Page 382 and 383:
Littell, J. S., M. M. Elsner, L. C.
- Page 384 and 385:
American Meteorological Society 78:
- Page 386 and 387:
and D. G. McDonald, editors. Global
- Page 388 and 389:
Mieog, J. C., J. L. Olsen, R. Berke
- Page 390 and 391:
Moser, H. G. 1967. Reproduction and
- Page 392 and 393:
offshore waters of the North Pacifi
- Page 394 and 395:
NMFS. 2008d. National Marine Fisher
- Page 396 and 397:
polycyclic aromatic hydrocarbons. E
- Page 398 and 399:
pectinata (Elasmobranchiomorphi: Pr
- Page 400 and 401:
(Lepidochelys kempii). Journal of H
- Page 402 and 403:
T. B. B. Smith, R., C. F. G. Jeffre
- Page 404 and 405:
Margolis, editors. Pacific Salmon L
- Page 406 and 407:
36:447-453. Seminoff, J. A., A. Res
- Page 408 and 409:
idley sea turtles: Evidence from ma
- Page 410 and 411:
Marine Ecology-Progress Series 377:
- Page 412 and 413:
Quality Criteria for Oil and Grease
- Page 414 and 415:
Veracruz, Mexico. United States Fis
- Page 416 and 417:
Virnstein, R. W. and L. J. Morris.
- Page 418 and 419:
Scotian Rivers have not declined in
- Page 420 and 421:
Williams, R., D. E. Bain, J. K. B.
- Page 422 and 423:
under the Endangered Species Act. W