sdu faculty of forestry journal special edition 2009 - Orman Fakültesi
sdu faculty of forestry journal special edition 2009 - Orman Fakültesi
sdu faculty of forestry journal special edition 2009 - Orman Fakültesi

You also want an ePaper? Increase the reach of your titles
YUMPU automatically turns print PDFs into web optimized ePapers that Google loves.
SDÜ ORMAN FAKÜLTESİ DERGİSİ<br />
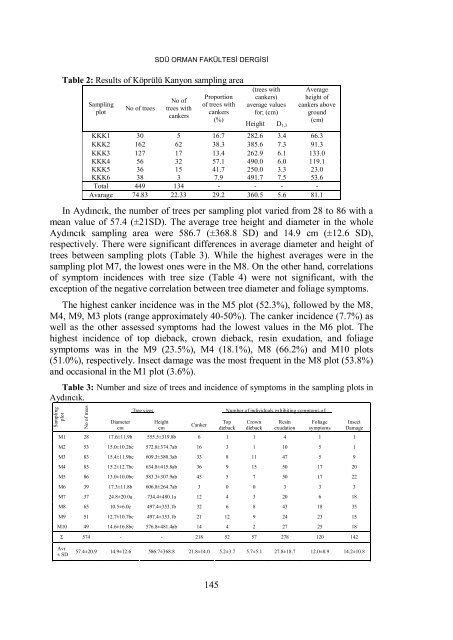
Table 2: Results <strong>of</strong> Köprülü Kanyon sampling area<br />
Sampling<br />
plot<br />
No <strong>of</strong> trees<br />
No <strong>of</strong><br />
trees with<br />
cankers<br />
Proportion<br />
<strong>of</strong> trees with<br />
cankers<br />
(%)<br />
145<br />
(trees with<br />
cankers)<br />
average values<br />
for; (cm)<br />
Height D1,3<br />
Average<br />
height <strong>of</strong><br />
cankers above<br />
ground<br />
(cm)<br />
KKK1 30 5 16.7 282.6 3.4 66.3<br />
KKK2 162 62 38.3 385.6 7.3 91.3<br />
KKK3 127 17 13.4 262.9 6.1 133.0<br />
KKK4 56 32 57.1 490.0 6.0 119.1<br />
KKK5 36 15 41.7 250.0 3.3 23.0<br />
KKK6 38 3 7.9 491.7 7.5 53.6<br />
Total 449 134 - - - -<br />
Avarage 74.83 22.33 29.2 360.5 5.6 81.1<br />
In Aydıncık, the number <strong>of</strong> trees per sampling plot varied from 28 to 86 with a<br />
mean value <strong>of</strong> 57.4 (±21SD). The average tree height and diameter in the whole<br />
Aydıncık sampling area were 586.7 (±368.8 SD) and 14.9 cm (±12.6 SD),<br />
respectively. There were significant differences in average diameter and height <strong>of</strong><br />
trees between sampling plots (Table 3). While the highest averages were in the<br />
sampling plot M7, the lowest ones were in the M8. On the other hand, correlations<br />
<strong>of</strong> symptom incidences with tree size (Table 4) were not significant, with the<br />
exception <strong>of</strong> the negative correlation between tree diameter and foliage symptoms.<br />
The highest canker incidence was in the M5 plot (52.3%), followed by the M8,<br />
M4, M9, M3 plots (range approximately 40-50%). The canker incidence (7.7%) as<br />
well as the other assessed symptoms had the lowest values in the M6 plot. The<br />
highest incidence <strong>of</strong> top dieback, crown dieback, resin exudation, and foliage<br />
symptoms was in the M9 (23.5%), M4 (18.1%), M8 (66.2%) and M10 plots<br />
(51.0%), respectively. Insect damage was the most frequent in the M8 plot (53.8%)<br />
and occasional in the M1 plot (3.6%).<br />
Table 3: Number and size <strong>of</strong> trees and incidence <strong>of</strong> symptoms in the sampling plots in<br />
Aydıncık.<br />
Sampling<br />
plot<br />
No <strong>of</strong> trees<br />
Diameter<br />
cm<br />
Tree sizes Number <strong>of</strong> individuals exhibiting symptoms <strong>of</strong>; .<br />
Height<br />
cm<br />
Canker<br />
Top<br />
dieback<br />
Crown<br />
dieback<br />
Resin<br />
exudation<br />
Foliage<br />
symptoms<br />
M1 28 17.6±11.9b 555.5±319.8b 6 1 1 4 1 1<br />
M2 53 15.0±10.2bc 572.8±374.7ab 16 3 1 10 5 1<br />
M3 83 15.4±11.9bc 609.3±380.3ab 33 8 11 47 5 9<br />
M4 83 15.2±12.7bc 634.8±415.8ab 36 9 15 50 17 20<br />
M5 86 13.0±10.0bc 583.3±307.9ab 45 5 7 50 17 22<br />
M6 39 17.3±11.8b 606.8±264.7ab 3 0 0 3 3 3<br />
M7 37 24.8±20.0a 734.4±480.1a 12 4 3 20 6 18<br />
M8 65 10.5±6.0c 497.4±353.1b 32 6 8 43 18 35<br />
M9 51 12.7±10.7bc 497.4±353.1b 21 12 9 24 23 15<br />
M10 49 14.6±16.8bc 576.8±481.4ab 14 4 2 27 25 18<br />
Σ 574 - - 218 52 57 278 120 142<br />
Avr.<br />
± SD<br />
57.4±20.9 14.9±12.6<br />
586.7±368.8<br />
Insect<br />
Damage<br />
21.8±14.0 5.2±3.7 5.7±5.1 27.8±18.7 12.0±8.9 14.2±10.8