A. Status of the Spectacled Eider - U.S. Fish and Wildlife Service
A. Status of the Spectacled Eider - U.S. Fish and Wildlife Service
A. Status of the Spectacled Eider - U.S. Fish and Wildlife Service
Create successful ePaper yourself
Turn your PDF publications into a flip-book with our unique Google optimized e-Paper software.
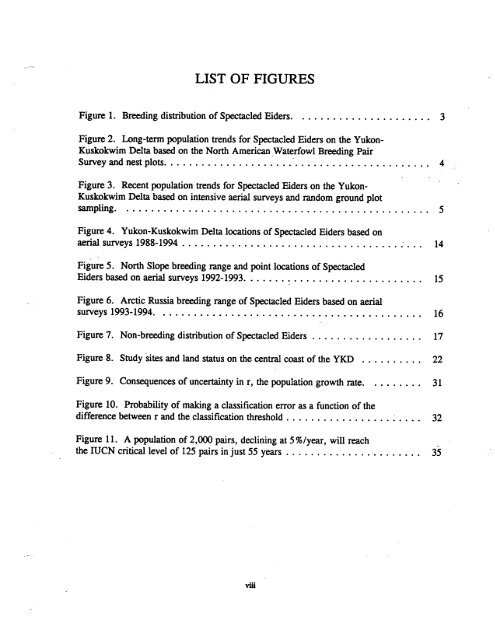
LIST OF FIGURES<br />
Figure 1. Breeding distribution <strong>of</strong> <strong>Spectacled</strong> <strong>Eider</strong>s 3<br />
Figure 2. Long-term population trends for <strong>Spectacled</strong> <strong>Eider</strong>s on <strong>the</strong> Yukon-<br />
Kuskokwim Delta based on <strong>the</strong> North American Waterfowl Breeding Pair<br />
Survey <strong>and</strong> nest plots 4<br />
Figure 3. Recent population trends for <strong>Spectacled</strong> <strong>Eider</strong>s on <strong>the</strong> Yukon-<br />
Kuskokwim Delta based on intensive aerial surveys <strong>and</strong> r<strong>and</strong>om ground plot<br />
sampling<br />
Figure 4. Yukon-Kuskokwim Delta locations <strong>of</strong> <strong>Spectacled</strong> <strong>Eider</strong>s based on<br />
aerial surveys 1988-1994 14<br />
Figure 5. North Slope breeding range <strong>and</strong> point locations <strong>of</strong> <strong>Spectacled</strong><br />
<strong>Eider</strong>s based on aerial surveys 1992-1993 15<br />
Figure 6. Arctic Russia breeding range <strong>of</strong> <strong>Spectacled</strong> <strong>Eider</strong>s based on aerial<br />
surveys 1993-1994 16<br />
Figure 7. Non-breeding distribution <strong>of</strong> <strong>Spectacled</strong> <strong>Eider</strong>s 17<br />
Figure 8. Study sites <strong>and</strong> l<strong>and</strong> status on <strong>the</strong> central coast <strong>of</strong> <strong>the</strong> YKD 22<br />
Figure 9. Consequences <strong>of</strong> uncertainty in r, <strong>the</strong> population growth rate 31<br />
Figure 10. Probability <strong>of</strong> making a classification error as a function <strong>of</strong> <strong>the</strong><br />
difference between r <strong>and</strong> <strong>the</strong> classification threshold 32<br />
Figure 11. A population <strong>of</strong> 2,000 pairs, declining at 5%/year, will reach<br />
<strong>the</strong> IUCN critical level <strong>of</strong> 125 pairs in just 55 years 35<br />
vili


