

A. Status of the Spectacled Eider - U.S. Fish and Wildlife Service
A. Status of the Spectacled Eider - U.S. Fish and Wildlife Service
A. Status of the Spectacled Eider - U.S. Fish and Wildlife Service

You also want an ePaper? Increase the reach of your titles
YUMPU automatically turns print PDFs into web optimized ePapers that Google loves.
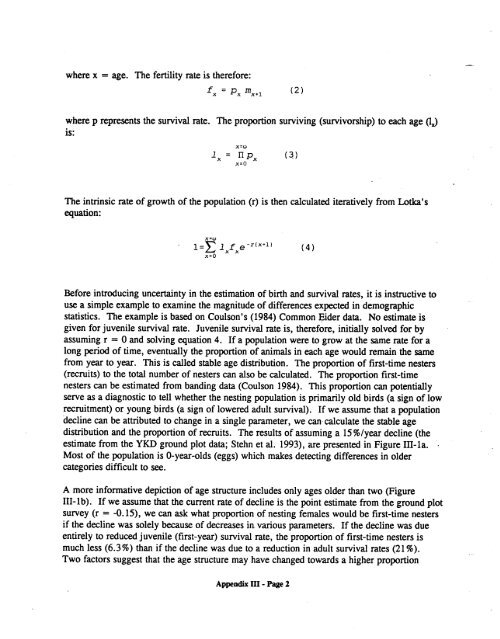
where x = age. The fertility rate is <strong>the</strong>refore:<br />
f= p m~ 1 (2)<br />
where p represents <strong>the</strong> survival rate. The proportion surviving (survivorship) to each age (li)<br />
is:<br />
X CC.)<br />
x=O<br />
The intrinsic rate <strong>of</strong> growth <strong>of</strong> <strong>the</strong> population (r) is <strong>the</strong>n calculated iteratively from Lotka’s<br />
equation:<br />
Before introducing uncertainty in <strong>the</strong> estimation <strong>of</strong> birth <strong>and</strong> survival rates, it is instructive to<br />
use a simple example to examine <strong>the</strong> magnitude <strong>of</strong> differences expected in demographic<br />
statistics. The example is based on Coulson’s (1984) Common <strong>Eider</strong> data. No estimate is<br />
given for juvenile survival rate. Juvenile survival rate is, <strong>the</strong>refore, initially solved for by<br />
assuming r = 0 <strong>and</strong> solving equation 4. If a population were to grow at <strong>the</strong> same rate for a<br />
long period <strong>of</strong> time, eventually <strong>the</strong> proportion <strong>of</strong>animals in each age would remain <strong>the</strong> same<br />
from year to year. This is called stable age distribution. The proportion <strong>of</strong> first-time nesters<br />
(recruits) to <strong>the</strong> total number <strong>of</strong> nesters can also be calculated. The proportion first-time<br />
nesters can be estimated from b<strong>and</strong>ing data (Coulson 1984). This proportion can potentially<br />
serve as a diagnostic to tell whe<strong>the</strong>r <strong>the</strong> nesting population is primarily old birds (a sign <strong>of</strong> low<br />
recruitment) or young birds (a sign <strong>of</strong> lowered adult survival). If we assume that a population<br />
decline can be attributed to change in a single parameter, we can calculate <strong>the</strong> stable age<br />
distribution <strong>and</strong> <strong>the</strong> proportion <strong>of</strong>recruits. The results <strong>of</strong> assuming a 15%/year decline (<strong>the</strong><br />
estimate from <strong>the</strong> YKD ground plot data; Stehn et al. 1993), are presented in Figure Ill-la.<br />
Most <strong>of</strong> <strong>the</strong> population is 0-year-olds (eggs) which makes detecting differences in older<br />
categories difficult to see.<br />
A more informative depiction <strong>of</strong> age structure includes only ages older than two (Figure<br />
llI-lb). If we assume that <strong>the</strong> current rate <strong>of</strong> decline is <strong>the</strong> point estimate from <strong>the</strong> ground plot<br />
survey (r = -0.15), we can ask what proportion <strong>of</strong> nesting females would be first-time nesters<br />
if <strong>the</strong> decline was solely because <strong>of</strong> decreases in various parameters. If <strong>the</strong> decline was due<br />
entirely to reduced juvenile (first-year) survival rate, <strong>the</strong> proportion <strong>of</strong> first-time nesters is<br />
much less (6.3%) than if <strong>the</strong> decline was due to a reduction in adult survival rates (21 %).<br />
Two factors suggest that <strong>the</strong> age structure may have changed towards a higher proportion<br />
Appendix III- Page 2


