A. Status of the Spectacled Eider - U.S. Fish and Wildlife Service
A. Status of the Spectacled Eider - U.S. Fish and Wildlife Service
A. Status of the Spectacled Eider - U.S. Fish and Wildlife Service
You also want an ePaper? Increase the reach of your titles
YUMPU automatically turns print PDFs into web optimized ePapers that Google loves.
If we knew <strong>the</strong> exact population growth rate we could simply make <strong>the</strong> decision that resulted<br />
in <strong>the</strong> smallest loss. For example, if r = -0.05, <strong>the</strong> decision to not classify would result in a<br />
loss <strong>of</strong> 0.06, while <strong>the</strong> decision to classify would result in a loss <strong>of</strong> zero. We are <strong>the</strong>refore<br />
likely to incur a greater loss (make a more costly decision) if we decide not to classify than if<br />
we chose to classify <strong>the</strong> populations. We would <strong>the</strong>refore choose to classify <strong>the</strong> populations as<br />
endangered so as to minimize loss. Although <strong>the</strong> estimate <strong>of</strong> r will contain large degrees <strong>of</strong><br />
uncertainty, <strong>the</strong> Bayesian analysis produces a distribution giving <strong>the</strong> probability <strong>of</strong> having<br />
obtained <strong>the</strong> existing trend data (from annual surveys) for each population growth rate. We<br />
can <strong>the</strong>n estimate <strong>the</strong> losses from over <strong>and</strong> under-protection errors by multiplying <strong>the</strong> loss<br />
function times <strong>the</strong> probability <strong>of</strong> r given <strong>the</strong> trend data for each possible value <strong>of</strong> r <strong>and</strong><br />
summing <strong>the</strong>se products to get <strong>the</strong> total loss.<br />
Figure 10 shows a hypo<strong>the</strong>tical example with a probability distribution for r superimposed on<br />
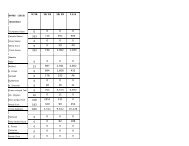
<strong>the</strong> loss functions. Table 1 in Appendix II shows a simplified calculation <strong>of</strong> <strong>the</strong> total losses to<br />
illustrate <strong>the</strong> multiplication process. For this example <strong>the</strong> under-protection loss (0.124) is over<br />
100 times <strong>the</strong> over-protection loss (0.001) 50 <strong>the</strong> decision that minimizes loss is to classify <strong>the</strong><br />
population.<br />
Thresholds<br />
A recovery plan must establish quantitative criteria for reclassifying a species or population<br />
from threatened to endangered (<strong>and</strong> vice-versa), as well as for delisting entirely. These<br />
criteria can be thought <strong>of</strong> as action thresholds. For each possible reclassification (including<br />
delisting), this plan provides two alternative criteria which independently trigger a reevaluation<br />
<strong>of</strong> <strong>the</strong> population’s status. The first alternative in each case couples trend <strong>and</strong> abundance data;<br />
when trend data are lacking, <strong>the</strong> second alternative allows for decision-making using only an<br />
estimate <strong>of</strong> abundance. For declining populations, <strong>the</strong> abundance thresholds coupled with<br />
trend data are greater than <strong>the</strong> thresholds when trend data are lacking. Conversely, when<br />
populations are increasing, <strong>the</strong> abundance thresholds coupled with trend data are lower than<br />
<strong>the</strong> thresholds when trend data are lacking. In both cases, a change in status is warranted<br />
sooner if <strong>the</strong> direction <strong>and</strong> magnitude <strong>of</strong>population change are known.<br />
Appendix I develops <strong>the</strong> rationale for selecting specific quantitative thresholds. For declining<br />
populations, thresholds should provide time to identify <strong>the</strong> cause(s) <strong>of</strong> decline <strong>and</strong> implement<br />
recovery actions before <strong>the</strong> population shrinks to dangerously low levels. For growing<br />
populations, <strong>the</strong> thresholds should guarantee that progress to recovery cannot be reversed<br />
easily, while simultaneously ensuring that <strong>the</strong> rigorous protection <strong>of</strong> <strong>the</strong> Endangered Species<br />
Act is not unnecessarily extended. The reader should note, however, that <strong>the</strong> uncertainty in<br />
trend <strong>and</strong> abundance estimates is exacerbated by an even greater uncertainty in <strong>the</strong> efficacy <strong>of</strong><br />
recovery efforts. We are unable to predict exactly how quickly a population will decline or<br />
how quickly it will respond to recovery efforts. As a result, <strong>the</strong> selection <strong>of</strong> thresholds<br />
involves a blend <strong>of</strong> both science <strong>and</strong> intuition, <strong>and</strong> is, <strong>the</strong>refore, somewhat arbitrary. Like<br />
medical guidelines for conditions such as high blood pressure <strong>and</strong> high cholesterol, population<br />
33


