A. Status of the Spectacled Eider - U.S. Fish and Wildlife Service
A. Status of the Spectacled Eider - U.S. Fish and Wildlife Service
A. Status of the Spectacled Eider - U.S. Fish and Wildlife Service
You also want an ePaper? Increase the reach of your titles
YUMPU automatically turns print PDFs into web optimized ePapers that Google loves.
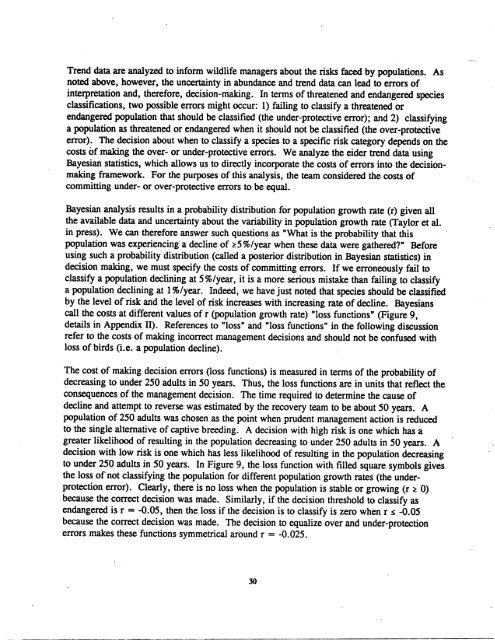
Trend data are analyzed to inform wildlife managers about <strong>the</strong> risks faced by populations. As<br />
noted above, however, <strong>the</strong> uncertainty in abundance <strong>and</strong> trend data can lead to errors <strong>of</strong><br />
interpretation <strong>and</strong>, <strong>the</strong>refore, decision-making. In terms <strong>of</strong> threatened <strong>and</strong> endangered species<br />
classifications, two possible errors might occur: 1) failing to classify a threatened or<br />
endangered population that should be classified (<strong>the</strong> under-protective error); <strong>and</strong> 2) classifying<br />
a population as threatened or endangered when it should not be classified (<strong>the</strong> over-protective<br />
error). The decision about when to classify a species to a specific risk category depends on <strong>the</strong><br />
costs <strong>of</strong> making <strong>the</strong> over- or under-protective errors. We analyze <strong>the</strong> eider trend data using<br />
Bayesian statistics, which allows us to directly incorporate <strong>the</strong> costs <strong>of</strong> errors into <strong>the</strong> decisionmaking<br />
framework. For <strong>the</strong> purposes <strong>of</strong> this analysis, <strong>the</strong> team considered <strong>the</strong> costs <strong>of</strong><br />
committing under- or over-protective errors to be equal.<br />
Bayesian analysis results in a probability distribution for population growth rate (r) given all<br />
<strong>the</strong> available data <strong>and</strong> uncertainty about <strong>the</strong> variability in population growth rate (Taylor et al.<br />
in press). We can <strong>the</strong>refore answer such questions as “What is <strong>the</strong> probability that this<br />
population was experiencing a decline <strong>of</strong> ~5%/year when <strong>the</strong>se data were ga<strong>the</strong>red?” Before<br />
using such a probability distribution (called a posterior distribution in Bayesian statistics) in<br />
decision making, we must specify <strong>the</strong> costs <strong>of</strong> committing errors. If we erroneously fail to<br />
classify a population declining at 5%/year, it is a more serious mistake than failing to classify<br />
a population declining at 1 %/year. Indeed, we have just noted that species should be classified<br />
by <strong>the</strong> level <strong>of</strong> risk <strong>and</strong> <strong>the</strong> level <strong>of</strong>risk increases with increasing rate <strong>of</strong> decline. Bayesians<br />
call <strong>the</strong> costs at different values <strong>of</strong> r (population growth rate) “loss functions” (Figure 9,<br />
details in Appendix II). References to “loss” <strong>and</strong> “loss functions” in <strong>the</strong> following discussion<br />
refer to <strong>the</strong> costs <strong>of</strong> making incorrect management decisions <strong>and</strong> should not be confused with<br />
loss <strong>of</strong>birds (i.e. a population decline).<br />
The cost <strong>of</strong> making decision errors (loss functions) is measured in terms <strong>of</strong> <strong>the</strong> probability <strong>of</strong><br />
decreasing to under 250 adults in 50 years. Thus, <strong>the</strong> loss functions are in units that reflect <strong>the</strong><br />
consequences <strong>of</strong> <strong>the</strong> management decision. The time required to determine <strong>the</strong> cause <strong>of</strong><br />
decline <strong>and</strong> attempt to reverse was estimated by <strong>the</strong> recovery team to be about 50 years. A<br />
population <strong>of</strong> 250 adults was chosen as <strong>the</strong> point when prudent management action is reduced<br />
to <strong>the</strong> single alternative <strong>of</strong> captive breeding. A decision with high risk is one which has a<br />
greater likelihood <strong>of</strong> resulting in <strong>the</strong> population decreasing to under 250 adults in 50 years. A<br />
decision with low risk is one which has less likelihood <strong>of</strong> resulting in <strong>the</strong> population decreasing<br />
to under 250 adults in 50 years. In Figure 9, <strong>the</strong> loss function with filled square symbols gives<br />
<strong>the</strong> loss <strong>of</strong>not classifying <strong>the</strong> population for different population growth rates (<strong>the</strong> underprotection<br />
error). Clearly, <strong>the</strong>re is no loss when <strong>the</strong> population is stable or growing (r =0)<br />
because <strong>the</strong> correct decision was made. Similarly, if <strong>the</strong> decision threshold to classify as<br />
endangered is r = -0.05, <strong>the</strong>n <strong>the</strong> loss if <strong>the</strong> decision is to classify is zero when r =-0.05<br />
because <strong>the</strong> correct decision was made. The decision to equalize over <strong>and</strong> under-protection<br />
errors makes <strong>the</strong>se functions symmetrical around r = -0.025.<br />
30


