

A. Status of the Spectacled Eider - U.S. Fish and Wildlife Service
A. Status of the Spectacled Eider - U.S. Fish and Wildlife Service
A. Status of the Spectacled Eider - U.S. Fish and Wildlife Service

You also want an ePaper? Increase the reach of your titles
YUMPU automatically turns print PDFs into web optimized ePapers that Google loves.
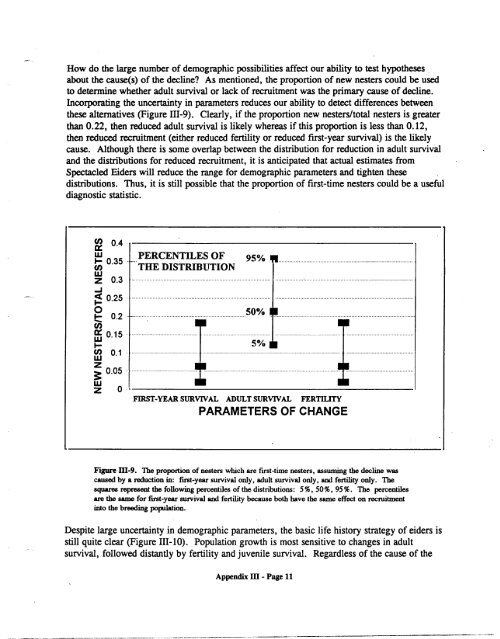
How do <strong>the</strong> large number <strong>of</strong> demographic possibilities affect our ability to test hypo<strong>the</strong>ses<br />
about <strong>the</strong> cause(s) <strong>of</strong> <strong>the</strong> decline? As mentioned, <strong>the</strong> proportion <strong>of</strong> new nesters could be used<br />
to determine whe<strong>the</strong>r adult survival or lack <strong>of</strong> recruitment was <strong>the</strong> primary cause <strong>of</strong>decline.<br />
Incorporating <strong>the</strong> uncertainty in parameters reduces our ability to detect differences between<br />
<strong>the</strong>se alternatives (Figure 111-9). Clearly, if <strong>the</strong> proportion new nesters/total nesters is greater<br />
than 0.22, <strong>the</strong>n reduced adult survival is likely whereas if this proportion is less than 0.12,<br />
<strong>the</strong>n reduced recruitment (ei<strong>the</strong>r reduced fertility or reduced first-year survival) is <strong>the</strong> likely<br />
cause. Although <strong>the</strong>re is some overlap between <strong>the</strong> distribution for reduction in adult survival<br />
<strong>and</strong> <strong>the</strong> distributions for reduced recruitment, it is anticipated that actual estimates from<br />
<strong>Spectacled</strong> <strong>Eider</strong>s will reduce <strong>the</strong> range for demographic parameters <strong>and</strong> tighten <strong>the</strong>se<br />
distributions. Thus, it is still possible that <strong>the</strong> proportion <strong>of</strong> first-time nesters could be a useful<br />
diagnostic statistic.<br />
Ci~ 0.4<br />
‘U<br />
1— 0.35<br />
(0<br />
‘U<br />
z 0.3<br />
-J<br />
~0. 25<br />
0<br />
~0.2<br />
(0<br />
~0. 15<br />
I-<br />
0.1<br />
~0. 05<br />
‘U<br />
z 0<br />
PERCENTILES OF 95%<br />
THE DISTRIBUTION<br />
50%<br />
Figure ~-9. The proportion <strong>of</strong> nesters which are first-time nesters, assuming <strong>the</strong> decline was<br />
caused by a reduction in: first-year survival only, adult survival only, <strong>and</strong> fertility only. The<br />
squares represent <strong>the</strong> following percentiles <strong>of</strong> <strong>the</strong> distributions: 5%, 50%, 95%. The percentiles<br />
are <strong>the</strong> same for first-year survival <strong>and</strong> fertility because both have <strong>the</strong> same effect on recmitment<br />
into <strong>the</strong> breeding population.<br />
5%<br />
FIRST-YEAR SURVIVAL ADULT SURVIVAL FERTILiTY<br />
PARAMETERS OF CHANGE<br />
Despite large uncertainty in demographic parameters, <strong>the</strong> basic life history strategy <strong>of</strong> eiders is<br />
still quite clear (Figure 111-10). Population growth is most sensitive to changes in adult<br />
survival, followed distantly by fertility <strong>and</strong> juvenile survival. Regardless <strong>of</strong> <strong>the</strong> cause <strong>of</strong> <strong>the</strong><br />
Appendix m - Page 11


