- Page 1 and 2:
COMMITTEE FOR CONSULTATIONS ON THE
- Page 4 and 5:
VOLUME - I C O N T E N T S Prologue
- Page 6 and 7:
2. To look back, Andhra Pradesh was
- Page 8 and 9:
APPROACH AND METHODOLOGY The Commit
- Page 10 and 11:
The Committee was mandated to submi
- Page 12 and 13:
While the first phase included buil
- Page 14 and 15:
the Experts / Institutions to condu
- Page 16 and 17:
ACKNOWLEDGEMENTS The mandate assign
- Page 18 and 19:
Committee is particularly grateful
- Page 20 and 21:
Directors, S/Shri Amitabh Kharkwal,
- Page 22 and 23:
4.10 Rural and Urban Population 199
- Page 24 and 25:
LIST OF FIGURES Figure No. Title Pa
- Page 26 and 27:
2.42 Deprivation index across regio
- Page 28 and 29:
4.14 Comparison - GDP per capita -
- Page 30 and 31:
1.2 Excerpts from the Report of the
- Page 32 and 33:
3.11 Regional Universities 156 3.12
- Page 34 and 35:
CEA Central Electricity Authority C
- Page 36 and 37:
KTPS Kothagudam Thermal Power Stati
- Page 38 and 39:
RBI Reserve Bank of India RDS Rajol
- Page 40 and 41:
C H A PTER 1 D E V E L OPMENTS IN A
- Page 42 and 43:
was set up on July 5, 1954, and was
- Page 44 and 45:
egional consciousness but also make
- Page 46 and 47:
the more advanced people of the coa
- Page 48 and 49:
organization called Vishalandhra Ma
- Page 50 and 51:
views on the same were somewhat div
- Page 52 and 53:
6. The position of Urdu in the admi
- Page 54 and 55:
February, 1956. We have today furth
- Page 56 and 57:
services in the area is concerned;
- Page 58 and 59:
permanent bench or benches of the H
- Page 60 and 61:
Minister. The arrangement of Chief
- Page 62 and 63:
Telangana region, which appeared be
- Page 64 and 65:
espect thereof. Toward this end, on
- Page 66 and 67:
e final and binding on the Council
- Page 68 and 69:
grievances when the political situa
- Page 70 and 71:
the Central Government to make rule
- Page 72 and 73:
appointed for the purpose and the c
- Page 74 and 75:
against the ruling of the Andhra Pr
- Page 76 and 77:
implementation of the Six Point For
- Page 78 and 79:
the same was put to implementation,
- Page 80 and 81:
grievances of services. The Andhra
- Page 82 and 83:
Report of the second Commission on
- Page 84 and 85:
manufacturing and trade, which brin
- Page 86 and 87:
contentious for the Government empl
- Page 88 and 89:
ecommendations of the One-Man Commi
- Page 90 and 91:
MLAs of the Congress from Telangana
- Page 92 and 93:
June 7, 2004, mention was made that
- Page 94 and 95:
success of the TRS in 2004 to their
- Page 96 and 97:
1.5.02 With the situation becoming
- Page 98 and 99:
career prospects of the youth and t
- Page 100 and 101:
1.5.09 The bye-elections for the tw
- Page 102 and 103:
1.5.12 The entire working of the Co
- Page 104 and 105:
2 REGIONAL ECONOMIC AND EQUITY ANAL
- Page 106 and 107:
2.1.03 The state is divided into th
- Page 108 and 109:
Table 2.2: Per Capita DDP Aggregate
- Page 110 and 111:
18 16 14 12 10 -2 Percent 8 6 4 2 0
- Page 112 and 113:
egion. However, if Hyderabad is inc
- Page 114 and 115:
note that the need for agricultural
- Page 116 and 117:
Such data for the most recent year
- Page 118 and 119:
(See Figure 2.12). Telangana receiv
- Page 120 and 121:
which is commendable. Coastal Andhr
- Page 122 and 123:
identifies such districts under the
- Page 124 and 125:
2.6.09 Motor Vehicular Strength, Ro
- Page 126 and 127:
Kms. Kms. Vehicles 25 20 15 10 5 0
- Page 128 and 129:
2.7.02 Growth in Irrigation Irrigat
- Page 130 and 131:
through canal system, mostly due to
- Page 132 and 133:
2.7.06 Changes in Land Productivity
- Page 134 and 135:
in case of percentage gross irrigat
- Page 136 and 137:
Percent Percent 35 30 25 20 15 10 5
- Page 138 and 139:
elatively higher WPR is generally c
- Page 140 and 141:
Table 2.6: Workers by level of educ
- Page 142 and 143:
egarding employment shares in rural
- Page 144 and 145:
only 1045 of which 183 were SCs, 73
- Page 146 and 147:
Table 2.7: Distribution of Out of D
- Page 148 and 149:
into five categories based on per c
- Page 150 and 151:
100 50 -50 -100 -150 60 50 40 30 20
- Page 152 and 153:
Table 2.8: Income Inequality (Gini
- Page 154 and 155:
A review of MPCE according to caste
- Page 156 and 157:
2.14 Social Profile Caste and relig
- Page 158 and 159:
2.15 Summary and Discussion 2.15.01
- Page 160 and 161:
Rayalaseema, and within the deprive
- Page 162 and 163:
due to want of time and space; a di
- Page 164 and 165:
gram panchayats) system of governan
- Page 166 and 167:
3 EDUCATION AND HEALTH The educatio
- Page 168 and 169:
progress and the gap in literacy ra
- Page 170 and 171:
The findings are quite dramatic - a
- Page 172 and 173:
1991 3 . However, Chapter 7 which p
- Page 174 and 175:
100% 90% 80% 70% 60% 50% 40% 30% 20
- Page 176 and 177:
Though the total number of primary
- Page 178 and 179:
from the learning outcomes of the c
- Page 180 and 181:
Source: Statistical Abstract Andhra
- Page 182 and 183:
number of SC students enrolled in t
- Page 184 and 185:
Osmania University was established
- Page 186 and 187:
Andhra University area comprising o
- Page 188 and 189:
775%) and the intake of students du
- Page 190 and 191:
school and junior college level, th
- Page 192 and 193:
As is clear, the average per capita
- Page 194 and 195:
3.7.03 In case of new regional univ
- Page 196 and 197:
3.7.07 The state government‟s rep
- Page 198 and 199:
Students from coastal Andhra, on th
- Page 200 and 201:
3.8.02 Andhra Pradesh is doing far
- Page 202 and 203:
3.8.06 After a thorough analysis of
- Page 204 and 205:
3.8.10 The Committee feels that the
- Page 206 and 207:
3.50 3.00 2.50 2.00 1.50 1.00 0.50
- Page 208 and 209:
1.4 1.2 1 0.8 0.6 0.4 0.2 0 Source:
- Page 210 and 211:
lac population also shows an improv
- Page 212 and 213:
the other districts of Telangana. A
- Page 214 and 215:
maternal health status like antenat
- Page 216 and 217:
3.11 Summing Up 3.11.01 Health infr
- Page 218 and 219:
4 WATER RESOURCES, IRRIGATION AND P
- Page 220 and 221:
lakes like Ramappa, Pakhal, Laknava
- Page 222 and 223:
cases. Some groups have pointed out
- Page 224 and 225:
4 .4.02 Land Utilization (i) The re
- Page 226 and 227:
Sl. No Name Design Pumping Head (m)
- Page 228 and 229:
Projects are also being taken up at
- Page 230 and 231:
Lakh Ha 20 18 16 14 12 10 8 6 4 2 0
- Page 232 and 233:
Lakh Ha. 25 20 15 10 5 0 Figure 4.6
- Page 234 and 235:
Percentage 60 50 40 30 20 10 0 Sour
- Page 236 and 237:
Table 4.8: Status of Tanks in Andhr
- Page 238 and 239:
Percentage 60 50 40 30 20 10 0 Sour
- Page 240 and 241:
Table 4.9: Regionwise Sectoral Cont
- Page 242 and 243:
Percentage 40 35 30 25 20 15 10 5 0
- Page 244 and 245:
problem, that has not been addresse
- Page 246 and 247:
4.5 Summing up The major grievances
- Page 248 and 249:
tanks can be revived or new check d
- Page 250 and 251:
(ii) Another grievance of Telangana
- Page 252 and 253:
conceived after reorganization. Bef
- Page 254 and 255:
would also address all the technica
- Page 256 and 257:
having specialized knowledge on irr
- Page 258 and 259:
PART II: POWER DEVELOPMENT IN ANDHR
- Page 260 and 261:
witnessed stupendous growth during
- Page 262 and 263:
towns and cities with population of
- Page 264 and 265:
Table 4.11: Generation installed ca
- Page 266 and 267:
4.10 Power - Gas The details of exi
- Page 268 and 269:
4.12 XII Plan Capacity Addition Tab
- Page 270 and 271:
4.13.04 The T&D system in all the t
- Page 272 and 273:
adopted in the 220 kV and 132 kV sy
- Page 274 and 275:
4.17.03 Category-wise sales of elec
- Page 276 and 277:
4.17.07 Region-wise number of exist
- Page 278 and 279:
Table 4.23: Subsidy provided to agr
- Page 280 and 281:
Table 4.27: Region-wise Abstract of
- Page 282 and 283:
4.18.01 From the analysis of variou
- Page 284 and 285:
in Telangana and Rayalaseema region
- Page 286 and 287:
CHAPTER 5 PUBLIC EMPLOYMENT I S S U
- Page 288 and 289:
5 _________________________________
- Page 290 and 291:
If a Mulki woman married a non-Mulk
- Page 292 and 293:
35. It is, therefore, necessary to
- Page 294 and 295:
High Command arranged a meeting of
- Page 296 and 297:
5.8 Articles 16 and 35 of the Const
- Page 298 and 299:
(2) In this section.- (a) “Subord
- Page 300 and 301: consultation with a committee of Ju
- Page 302 and 303: Public Employment (Requirement to R
- Page 304 and 305: existed for the people of the Telan
- Page 306 and 307: that the Mulki Rules were valid and
- Page 308 and 309: 5.19.04 On December 10, 1973, Presi
- Page 310 and 311: 5.22 The Constitution (Thirty-Secon
- Page 312 and 313: the civil services of and classes o
- Page 314 and 315: 1. Procedure to be followed for fur
- Page 316 and 317: 5.26.04 Actions Suggested The Commi
- Page 318 and 319: (3) officials of the state governme
- Page 320 and 321: • The Officers‟ Committee prese
- Page 322 and 323: • Clarification issued that the P
- Page 324 and 325: 5.29 Status of implementation of th
- Page 326 and 327: construed as having been so allotte
- Page 328 and 329: 5.31 Further action taken on the Su
- Page 330 and 331: fasting were sent to hospital. Gove
- Page 332 and 333: and that all appointments have been
- Page 334 and 335: anyway have increased by 2006 as co
- Page 336 and 337: Likewise, it is equally important t
- Page 338 and 339: 6 ISSUES RELATING TO HYDERABAD METR
- Page 340 and 341: 6.2.03 Around the time of its acces
- Page 342 and 343: 6.3.03 Concurrent with Naidu‟s se
- Page 344 and 345: constituencies, TDP and Congress ha
- Page 346 and 347: 6.5.05 The functions of GHMC includ
- Page 348 and 349: Table 6.1 Various Governance Struct
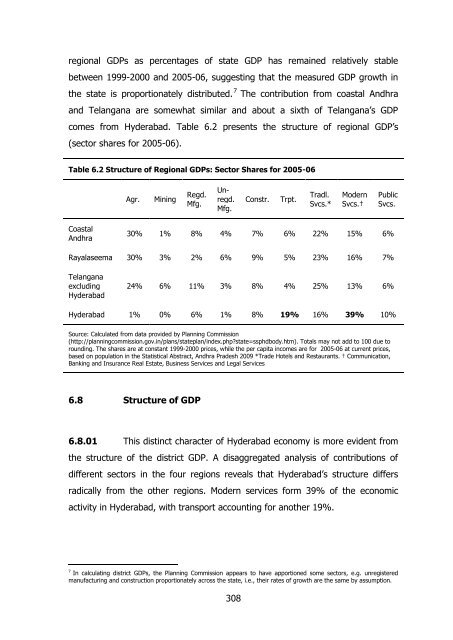
- Page 352 and 353: 6.8.02 Hyderabad and Rangareddy for
- Page 354 and 355: making the transition to being base
- Page 356 and 357: construction and traditional servic
- Page 358 and 359: 6.10.03 However, in terms of area,
- Page 360 and 361: estate developers from cities like
- Page 362 and 363: 6.12.05 While the IT sector helped
- Page 364 and 365: (f) The Hyderabad Metro Rail projec
- Page 366 and 367: to the other regions of Andhra Prad
- Page 368 and 369: Figure 6.5: Work and Business Relat
- Page 370 and 371: districts and less than half of the
- Page 372 and 373: Table 6.10B: Occupation of Circulat
- Page 374 and 375: investments for which cost informat
- Page 376 and 377: industries and the Eastern Naval Co
- Page 378 and 379: investing in grain trade, paddy col
- Page 380 and 381: complex. The economic structure of
- Page 382 and 383: in the Hyderabad Metropolitan regio
- Page 384 and 385: 7 _________________________________
- Page 386 and 387: 7.1.06 The preceding chapters of th
- Page 388 and 389: ights in and access to Hyderabad. A
- Page 390 and 391: 7.1.15 The second basis of their re
- Page 392 and 393: it in different parts of the state
- Page 394 and 395: enquiry that not a single person fr
- Page 396 and 397: Andhra regions. Being the most back
- Page 398 and 399: area for so many years. The consequ
- Page 400 and 401:
egionalism is a movement which is n
- Page 402 and 403:
2010. Thus groups have formed into
- Page 404 and 405:
sample NSSO 2004/5 survey are not r
- Page 406 and 407:
The results are the same if instead
- Page 408 and 409:
The findings from the quantitative
- Page 410 and 411:
distribution of SC communities in t
- Page 412 and 413:
community is larger (61.3%) in Tela
- Page 414 and 415:
7.9.07 Analysis The Madiga communit
- Page 416 and 417:
7.9.10 Telangana: The All India Ban
- Page 418 and 419:
7.9.14 Adivasis and the Manya Seema
- Page 420 and 421:
Reddys, will face submergence due t
- Page 422 and 423:
egion would face loss of employment
- Page 424 and 425:
over the bifurcation issue can be a
- Page 426 and 427:
Rayalaseema: The Muslim community i
- Page 428 and 429:
Christians. Reservations are the is
- Page 430 and 431:
entrants into higher education and
- Page 432 and 433:
7.13 Caste, Tribe, Religion, Region
- Page 434 and 435:
7.14 Cultural Issues 7.14.01 In thi
- Page 436 and 437:
of the distribution of linguistic c
- Page 438 and 439:
social class. Thus, even coastal An
- Page 440 and 441:
transformed in recent times with id
- Page 442 and 443:
celebrated by four or five mandals,
- Page 444 and 445:
Andhra, and the occupations of back
- Page 446 and 447:
7.15.14 While the Committee had nei
- Page 448 and 449:
many new arrivals become locals aft
- Page 450 and 451:
(a) Home (b) Finance (c) Revenue (d
- Page 452 and 453:
(5) On the whole (from 1956 - 2010)
- Page 454 and 455:
accommodated in the Council of Mini
- Page 456 and 457:
three regions of the state. These s
- Page 458 and 459:
such as the Chenchus. There is no d
- Page 460 and 461:
7.18.11 At the political level, a p
- Page 462 and 463:
Table 7B: Socio-Cultural Groups and
- Page 464 and 465:
Table 7D: Socio-Cultural Groups and
- Page 466 and 467:
C H A PTER 8 LAW & ORDER AND INTERN
- Page 468 and 469:
C H A PTER 9 THE WAY FOR W A RD 9.1
- Page 470 and 471:
EQUALITY of status and of opportuni
- Page 472 and 473:
Jammu and Kashmir was given a speci
- Page 474 and 475:
6. Kerala: Formed by the merger of
- Page 476 and 477:
9.1.11 North East India consists of
- Page 478 and 479:
favour the “strong-centre” conc
- Page 480 and 481:
favour of creation of smaller state
- Page 482 and 483:
Federation, it is learnt, was inaug
- Page 484 and 485:
the country. 8 Creation of these th
- Page 486 and 487:
for some time. Besides, sporadic ag
- Page 488 and 489:
(b) It was considered that this opt
- Page 490 and 491:
this option may have economic justi
- Page 492 and 493:
The extended Union Territory will c
- Page 494 and 495:
would not be happy with a common ca
- Page 496 and 497:
c) The division of the state will a
- Page 498 and 499:
option. Separation is recommended o
- Page 500 and 501:
transferred to the Council and its
- Page 502 and 503:
egions. The core issue being one of
- Page 504 and 505:
for enlarging the existing role of