The Development of Neural Network Based System Identification ...
The Development of Neural Network Based System Identification ...
The Development of Neural Network Based System Identification ...

You also want an ePaper? Increase the reach of your titles
YUMPU automatically turns print PDFs into web optimized ePapers that Google loves.
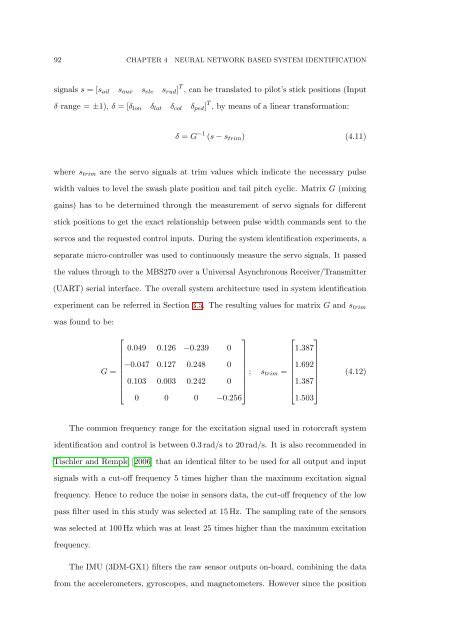
92 CHAPTER 4 NEURAL NETWORK BASED SYSTEM IDENTIFICATION<br />
signals s = [s ail s aux s ele s rud ] T , can be translated to pilot’s stick positions (Input<br />
δ range = ±1), δ = [δ lon δ lat δ col δ ped ] T , by means <strong>of</strong> a linear transformation:<br />
δ = G −1 (s − s trim ) (4.11)<br />
where s trim are the servo signals at trim values which indicate the necessary pulse<br />
width values to level the swash plate position and tail pitch cyclic. Matrix G (mixing<br />
gains) has to be determined through the measurement <strong>of</strong> servo signals for different<br />
stick positions to get the exact relationship between pulse width commands sent to the<br />
servos and the requested control inputs. During the system identification experiments, a<br />
separate micro-controller was used to continuously measure the servo signals. It passed<br />
the values through to the MBS270 over a Universal Asynchronous Receiver/Transmitter<br />
(UART) serial interface. <strong>The</strong> overall system architecture used in system identification<br />
experiment can be referred in Section 3.5. <strong>The</strong> resulting values for matrix G and s trim<br />
was found to be:<br />
⎡<br />
⎤<br />
⎡ ⎤<br />
0.049 0.126 −0.239 0<br />
1.387<br />
−0.047 0.127 0.248 0<br />
1.692<br />
G =<br />
; s trim =<br />
⎢ 0.103 0.003 0.242 0 ⎥<br />
⎢1.387⎥<br />
⎣<br />
⎦<br />
⎣ ⎦<br />
0 0 0 −0.256<br />
1.503<br />
(4.12)<br />
<strong>The</strong> common frequency range for the excitation signal used in rotorcraft system<br />
identification and control is between 0.3 rad/s to 20 rad/s. It is also recommended in<br />
Tischler and Remple [2006] that an identical filter to be used for all output and input<br />
signals with a cut-<strong>of</strong>f frequency 5 times higher than the maximum excitation signal<br />
frequency. Hence to reduce the noise in sensors data, the cut-<strong>of</strong>f frequency <strong>of</strong> the low<br />
pass filter used in this study was selected at 15 Hz. <strong>The</strong> sampling rate <strong>of</strong> the sensors<br />
was selected at 100 Hz which was at least 25 times higher than the maximum excitation<br />
frequency.<br />
<strong>The</strong> IMU (3DM-GX1) filters the raw sensor outputs on-board, combining the data<br />
from the accelerometers, gyroscopes, and magnetometers. However since the position