The Development of Neural Network Based System Identification ...
The Development of Neural Network Based System Identification ...
The Development of Neural Network Based System Identification ...
You also want an ePaper? Increase the reach of your titles
YUMPU automatically turns print PDFs into web optimized ePapers that Google loves.
4.3 SYSTEM IDENTIFICATION WITH NEURAL NETWORK 115<br />
a diagonal matrix, ρ min I ≤ Q(0) ≤ ρ max I.<br />
4.3.6 Model Validation<br />
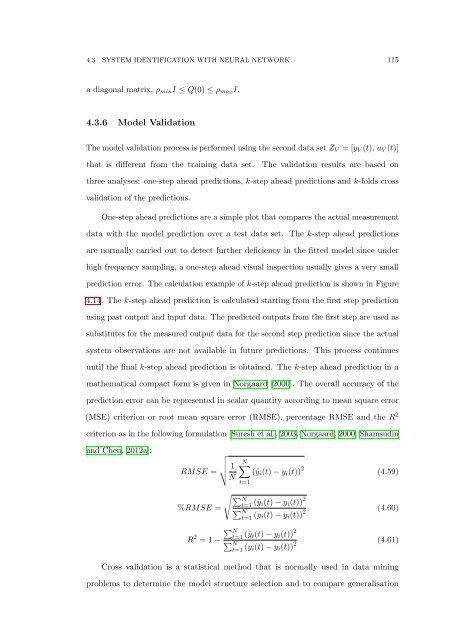
<strong>The</strong> model validation process is performed using the second data set Z V = [y V (t), u V (t)]<br />
that is different from the training data set.<br />
<strong>The</strong> validation results are based on<br />
three analyses: one-step ahead predictions, k-step ahead predictions and k-folds cross<br />
validation <strong>of</strong> the predictions.<br />
One-step ahead predictions are a simple plot that compares the actual measurement<br />
data with the model prediction over a test data set. <strong>The</strong> k-step ahead predictions<br />
are normally carried out to detect further deficiency in the fitted model since under<br />
high frequency sampling, a one-step ahead visual inspection usually gives a very small<br />
prediction error. <strong>The</strong> calculation example <strong>of</strong> k-step ahead prediction is shown in Figure<br />
4.14. <strong>The</strong> k-step ahead prediction is calculated starting from the first step prediction<br />
using past output and input data. <strong>The</strong> predicted outputs from the first step are used as<br />
substitutes for the measured output data for the second step prediction since the actual<br />
system observations are not available in future predictions. This process continues<br />
until the final k-step ahead prediction is obtained. <strong>The</strong> k-step ahead prediction in a<br />
mathematical compact form is given in Norgaard [2000]. <strong>The</strong> overall accuracy <strong>of</strong> the<br />
prediction error can be represented in scalar quantity according to mean square error<br />
(MSE) criterion or root mean square error (RMSE), percentage RMSE and the R 2<br />
criterion as in the following formulation [Suresh et al., 2003, Norgaard, 2000, Shamsudin<br />
and Chen, 2012a]:<br />
RMSE = √ 1 N<br />
N∑<br />
(ŷ i (t) − y i (t)) 2 (4.59)<br />
t=1<br />
%RMSE =<br />
√ ∑N<br />
t=1 (ŷ i(t) − y i (t)) 2<br />
∑ N<br />
t=1 (y i(t) − y i (t)) 2 (4.60)<br />
R 2 = 1 −<br />
∑ N<br />
t=1 (ŷ i(t) − y i (t)) 2<br />
∑ N<br />
t=1 (y i(t) − y i (t)) 2 (4.61)<br />
Cross validation is a statistical method that is normally used in data mining<br />
problems to determine the model structure selection and to compare generalisation


