The Development of Neural Network Based System Identification ...
The Development of Neural Network Based System Identification ...
The Development of Neural Network Based System Identification ...

You also want an ePaper? Increase the reach of your titles
YUMPU automatically turns print PDFs into web optimized ePapers that Google loves.
5.2 OFF-LINE BASED SYSTEM IDENTIFICATION FOR MLP NETWORK 131<br />
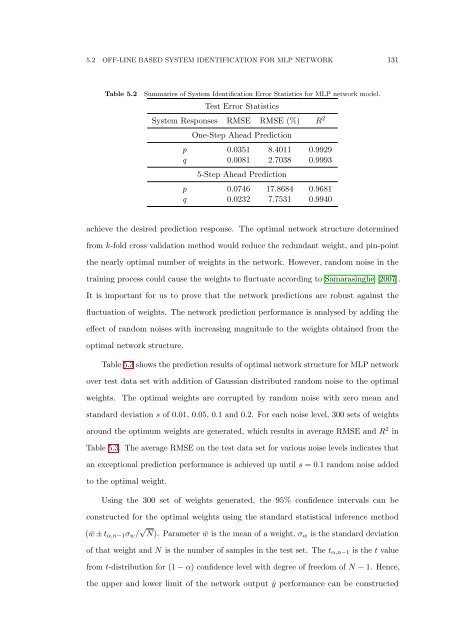
Table 5.2<br />
Summaries <strong>of</strong> <strong>System</strong> <strong>Identification</strong> Error Statistics for MLP network model.<br />
Test Error Statistics<br />
<strong>System</strong> Responses RMSE RMSE (%) R 2<br />
One-Step Ahead Prediction<br />
p 0.0351 8.4011 0.9929<br />
q 0.0081 2.7038 0.9993<br />
5-Step Ahead Prediction<br />
p 0.0746 17.8684 0.9681<br />
q 0.0232 7.7531 0.9940<br />
achieve the desired prediction response. <strong>The</strong> optimal network structure determined<br />
from k-fold cross validation method would reduce the redundant weight, and pin-point<br />
the nearly optimal number <strong>of</strong> weights in the network. However, random noise in the<br />
training process could cause the weights to fluctuate according to Samarasinghe [2007].<br />
It is important for us to prove that the network predictions are robust against the<br />
fluctuation <strong>of</strong> weights. <strong>The</strong> network prediction performance is analysed by adding the<br />
effect <strong>of</strong> random noises with increasing magnitude to the weights obtained from the<br />
optimal network structure.<br />
Table 5.3 shows the prediction results <strong>of</strong> optimal network structure for MLP network<br />
over test data set with addition <strong>of</strong> Gaussian distributed random noise to the optimal<br />
weights. <strong>The</strong> optimal weights are corrupted by random noise with zero mean and<br />
standard deviation s <strong>of</strong> 0.01, 0.05, 0.1 and 0.2. For each noise level, 300 sets <strong>of</strong> weights<br />
around the optimum weights are generated, which results in average RMSE and R 2 in<br />
Table 5.3. <strong>The</strong> average RMSE on the test data set for various noise levels indicates that<br />
an exceptional prediction performance is achieved up until s = 0.1 random noise added<br />
to the optimal weight.<br />
Using the 300 set <strong>of</strong> weights generated, the 95% confidence intervals can be<br />
constructed for the optimal weights using the standard statistical inference method<br />
( ¯w ± t α,n−1 σ w / √ N). Parameter ¯w is the mean <strong>of</strong> a weight, σ w is the standard deviation<br />
<strong>of</strong> that weight and N is the number <strong>of</strong> samples in the test set. <strong>The</strong> t α,n−1 is the t value<br />
from t-distribution for (1 − α) confidence level with degree <strong>of</strong> freedom <strong>of</strong> N − 1. Hence,<br />
the upper and lower limit <strong>of</strong> the network output ŷ performance can be constructed